These features may comprise points (useful for describing addresses or locations), line strings (suited to streets, highways, etc...) and polygons
Importing a dataset from a GIS or CSV file
-
The dataset import feature can be found on the layers panel. To import a new dataset click Import dataset layer

-
Datasets can be uploaded from a local machine or by pointing to the URL at which they are hosted. Podaris currently accepts the following file formats for datasets: .geojson, .json, .kml, ShapeFile (must be uploaded as a zipped file), and .csv
(If you're looking to use a format that is not currently supported, please get in touch)
Podaris does not support multipart geometries. Any such features will be flattened into single-part features automatically, with any attributes copied to the created features.
- Once your dataset has been uploaded, you can choose which attributes to import by ticking or unticking each attribute's import checkbox and assigning them an appropriate data type (string, number or boolean). Click IMPORT to finish.

For large datasets connecting to an external GIS server is likely to provide better performance when editing and viewing your project. If you require any assistance, please contact support who are happy to help discuss the best ways to import data.
Importing a dataset using the Podaris data library
The Podaris 'data library' is designed to make it easier for you to source and start working with datasets in Podaris.
The data library contains datasets including UK Census data, administrative boundaries, and point of interest (POI) data such as schools and healthcare datasets. Instead of having to search the internet or large databases to source your datasets, you can now access a large number of datasets through this data library in just a few clicks!
To import a dataset from the Podaris data library in a Podaris:Plan project:
- Open the Layers panel
- Click on the "Add from data library" icon. This will open up a list of datasets available for the geographic area your Podaris map is currently zoomed to

- Select a dataset option, e.g. 'Secondary Education'

- Draw a polygon around the area you would like to import this data for

- Podaris will begin to collect this data and import all data points that lie within the polygon boundary you drew in step 4. When the import is complete you will receive a notification

Once imported, you can edit, visualise, analyse and export this dataset. Read on to find out how datasets can be used and styled.
If there are any datasets missing from our data library that you would like to see available in future, get in touch with us to let us know at support@podaris.com.
Importing a dataset from OpenStreetMap queries within Podaris:Plan
-png.png?width=670&height=350&name=unnamed%20(2)-png.png)
New data layers can be created in Podaris:Plan by sourcing and importing from OpenStreetMap (OSM) in just a few simple steps.
When creating a data layer from OSM in Podaris:Plan you can:
- Define the area you want to import data for by drawing a polygon around your area of interest
- Choose the feature types you want to import (nodes, ways and relations)
- Add OSM queries, or use the AI feature to describe your data query in simple, plain-English descriptions and have Podaris generate the OSM queries for you
To create an OSM data layer in your Podaris project:
-
Open your project in Plan view
-
Go to the Layers panel
- In the Datasets section, click the 3 vertical dots and then select "Add from OpenStreetMap"

- In the modal that opens, define the following:
- Boundary = Click the pencil icon to draw a polygon around the area you would like to import OSM data for
- Layer name = Optionally give your layer a name that will display in the Datasets list in the Layers panel
- Feature types = Select the features you'd like to import (or leave this to automatically update if using the "Use AI" feature)
- For the Overpass Queries, either add (Key, Value) pairs directly, or use the "Use AI" feature to describe the dataset you want to import and let Podaris generate the Overpass Query for you

Using datasets
The below image shows polygon data from an imported dataset visualised in pink:
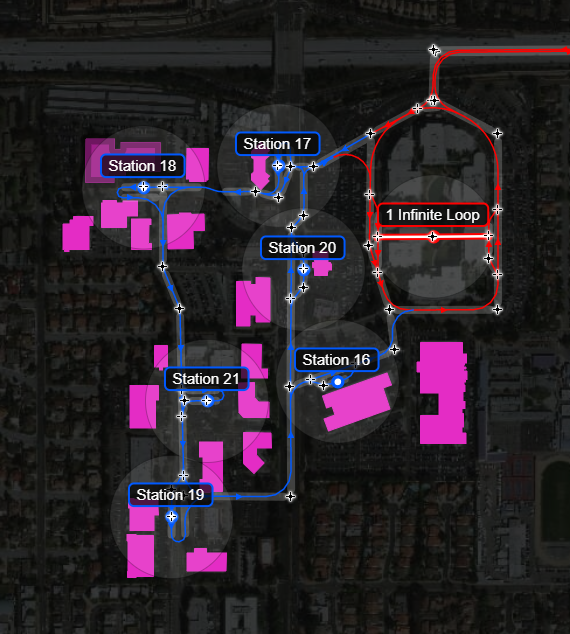
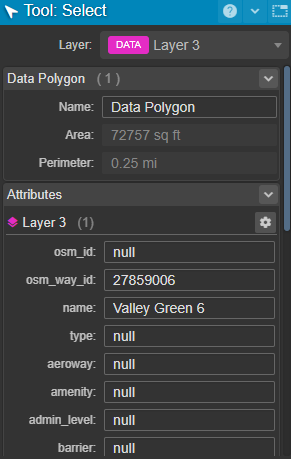
Clicking on a polygon will allow you to view (and change) all associated attributes, as well as view its perimeter and respective area.
In order to move this polygon, click once to select it and then again and drag it to a new location. Double-clicking will allow you to manually edit its coordinates.
Styling datasets
Styling datasets can be achieved by clicking the cog icon ![]() next to the dataset layer that you wish to modify. The color and appearance of points, polygons and linestrings can all be styled here. There is also the option to choose to hide or show a legend, which will then correspond to the styles/naming within the classes that you select.
next to the dataset layer that you wish to modify. The color and appearance of points, polygons and linestrings can all be styled here. There is also the option to choose to hide or show a legend, which will then correspond to the styles/naming within the classes that you select.

Styling by attribute
The fill color of polygons, linestrings, and points can be styled based on a dataset’s attributes.
This can be done by changing the data type to Simple, Categorical, or Numerical.
Doing so will bring up additional settings:
-
Simple – You can modify the existing classes, allowing you to change the fill color, stroke color, line color, and point color. You can also adjust the width and fill styles of lines and points. Additionally, you have the option to change the point icon style, as well as the point icon stroke color and width.
-
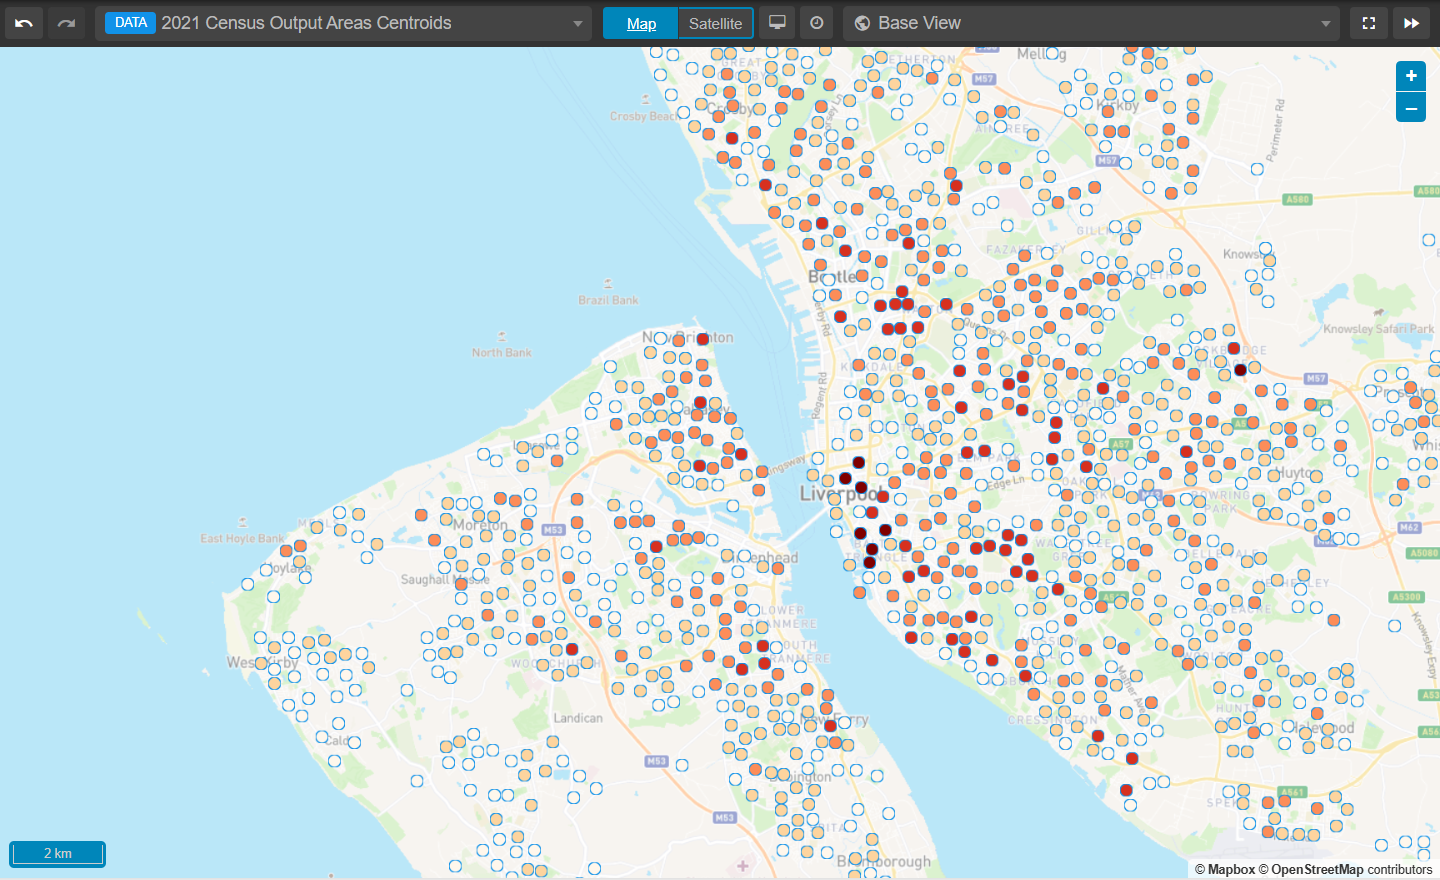
Categorical – You can select the relevant attribute from those set up in the Attributes tab. The color scheme depends on the number of classes: a single class requires one color, while multiple classes require a spectrum. Choose the color range to categorize the attribute values. The color scale reads from left to right, with the lowest values assigned the leftmost color and the highest values assigned the rightmost color. As with the Simple data type, you can adjust the color, fill, and point sizes, widths, and styles.

- Numerical – Similar to the Categorical data type, you can select the relevant attribute from the Attributes tab and then define the classes. As with the Simple and Categorical data types, you can modify the color, fill, point sizes, widths, and styles. The Numerical data type also includes the Steps Method, which provides options for defining class breaks: Jenks, Equal Interval, Manual, and Quantile.


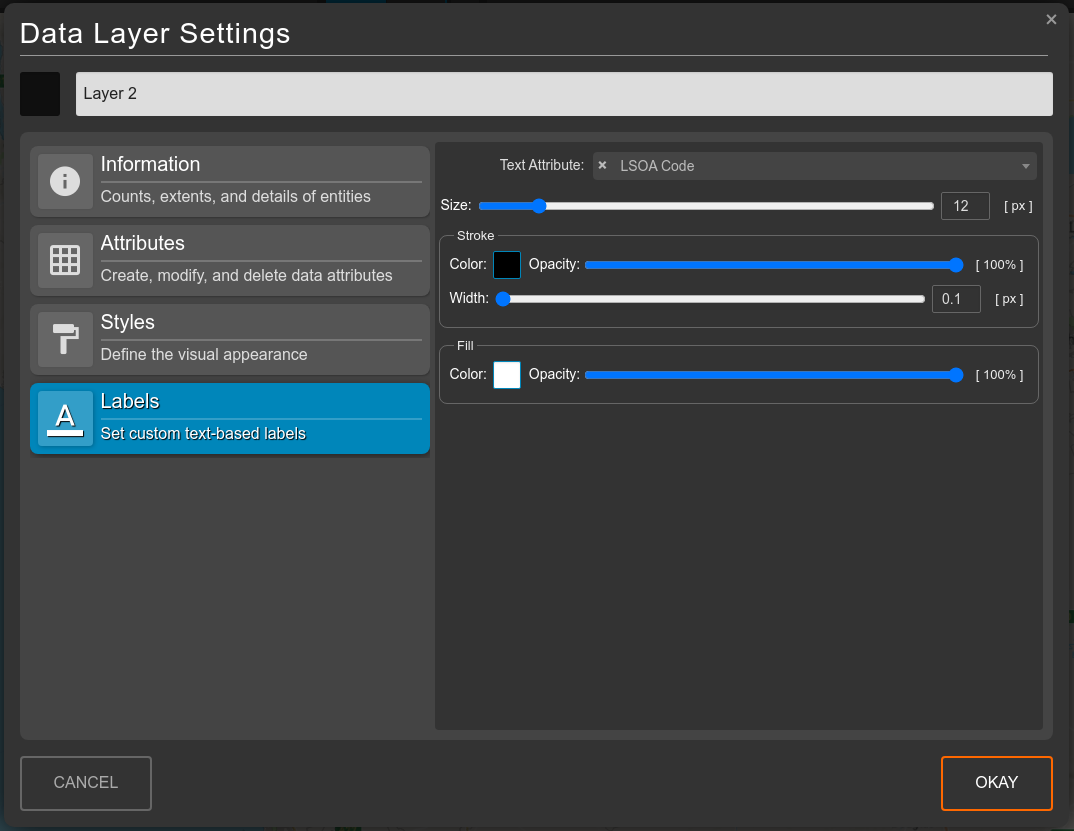
Labels
From within the Labels tab, you can choose to use any text-type attribute to display on the map above each feature. In order to set the attribute that will be visible as a layer next to each geometric element, select your preferred text attribute from the Labels box. From there you can also change the style of the label.
Amending attributes
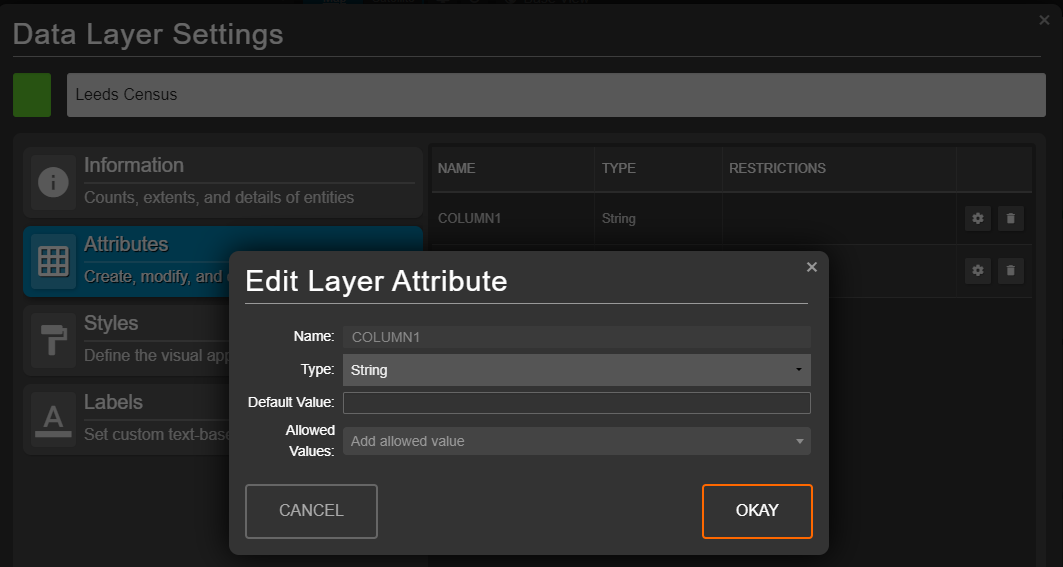
Clicking the cog icon ![]() next to the attribute that you wish to edit will allow you to change the attribute's type (string/number/Boolean), default value, as well as manually populate a list of allowed values.
next to the attribute that you wish to edit will allow you to change the attribute's type (string/number/Boolean), default value, as well as manually populate a list of allowed values.