If you have followed steps 1-6, you have now successfully created a road-based scheduled service.
Understanding the Trip Graph
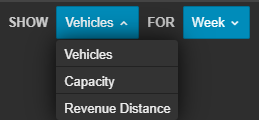
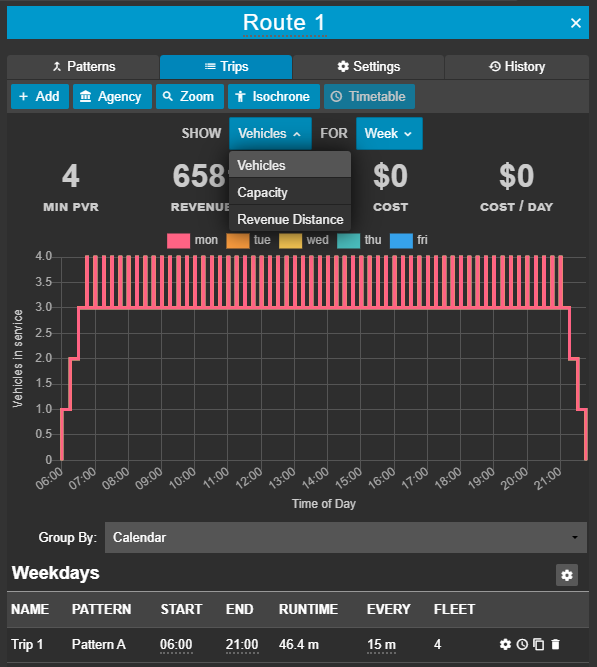
The above buttons allow you to view the following respective data as graphs for each day of the week that has been included in your service calendar, or for a particular date:
- Vehicles per hour vs time of day.
- Capacity vs time of day. Capacity here is calculated as vehicles p/hr * vehicle capacity.
- Revenue distance (the distance the service is running and accepting actual passengers, i.e the distance travelled minus any deadheadings or layovers, in km) vs day of the week.
Above this graph, you will also find:
- Minimum peak vehicle requirement
- Revenue distance
- Overall cost of the service
- Cost of running the service per day
Modifying the Trip Graph
Anything in Podaris with a dotted underline can usually be clicked on and edited.
- Click on the headway ('EVERY') of 15m and change the value to ‘2m’ and press enter. You should see the fleet size update to reflect how many vehicles would be needed for such a high service level.
Trips can also be edited in bulk, using the Edit Selected Trips feature in the trips tab.