What is Podaris:Insight?
Podaris:Insight is a toolkit for simplifying a number of types of accessibility analysis. It is designed to dramatically speed up the process of performing accessibility analysis on networks and datasets created or imported in Podaris. It provides a simple interface through which analysis projects can be created and shared, and the corresponding results exported. You can learn more about Podaris:Insight and the analysis types that it offers here.
What is the accessibility index type?
The accessibility index type allows you to specify a base network, one dataset with zones to travel from or to and one dataset with target locations to travel from or to. It assesses how long it takes to travel from one location to another, considering various modes of transportation and generating an index that categorises those areas.
Some possible use cases for this type of analysis are:
- To determine the employment opportunities accessible within a 45-minute public transportation commute for each census tract.
- To analyze the distribution of retail stores and supermarkets to ensure that residents have convenient access to essential goods and services.
- To assess how well social service centers, like welfare offices and community centers, are distributed to provide support to those in need.
This analysis type is valuable for identifying disparities in access and guide efforts to improve accessibility, particularly for disadvantaged or underserved populations. You can set transport mode as car, cycling, walking or transit within a given maximum duration (or maximum journey time). If you choose to analyse using the transit option, it's possible to configure settings such as departure or arrival time, maximum access distance (how much someone can walk to a transit station and from a transit station) and transfer limits.
At least one location must be specified as a target location - however datasets with multiple locations can be uploaded in the form of a geospatial data file (e.g. geojson).
Step by step
1. Add basic information, such as a name and description that will be visible to viewers of the project.
2 Select a base network, and as its views. It is possible to use different views from the same network project.
3. Add a dataset with zones. This can be plotted manually or uploaded from georeferenced dataset. When you choose to plot it manually, you can have H3 hexagons, square, points or hex as grid options for it.
4. Add a dataset with at least one target location. You need to have uploaded it previously as dataset to Podaris.
5. Select routing options to set how individuals or groups can access your targets. You can stablish type of travel as from or to, mode of journey and maximum durantion of travel. When using the transit mode, calendars associated with your networks will be used to inform calculations. Multiple departure times set in depart at can be specified, and Podaris will calculate the best accessibility from those times.
6. Click Save and Run Analysis. You will be notified when the analysis is complete.
Interpreting results
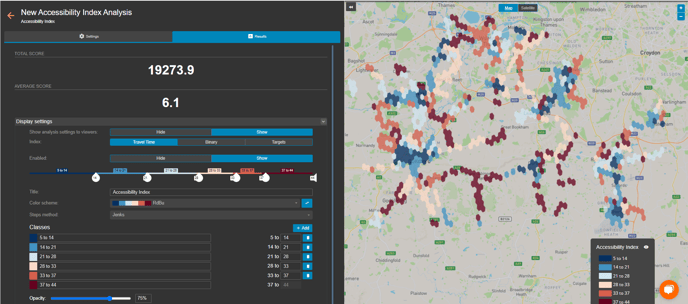
Accessibility is measured by the number of targets or the time of travel that can be reached from each zone within a given time. It will give the score by travel time (in minutes), number of targets or in a binary display of areas that are accessible or not accessible in the analysis.
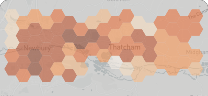
In this example, using a gradient from blue to red, it's represented the amount of time that someone can take to reach a target (hospital) that can reached in 45 minutes and with 2 buses. The total and average score considers all the covered area and not just those that are accessible in the same given time.
Exporting results
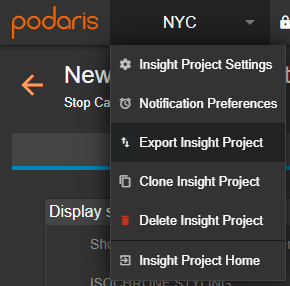
Your analyses can be exported by clicking the project name, and Export Analyse. From here, you can export in a variety of formats, such as GIS and CSV (comma separated values).