What is Podaris:Insight?
Podaris:Insight is a toolkit for simplifying a number of types of accessibility analysis. It is designed to dramatically speed up the process of performing accessibility analysis on networks and datasets created or imported in Podaris.
It provides a simple interface through which analysis projects can be created and shared, and the corresponding results exported. You can learn more about Podaris:Insight and the analysis types that it offers here.
What is the corridor frequency analysis type?
Step by Step
1. Add basic information such as a name and description that will be visible to viewers of the project.
2 Select a network and a view to be used in the analysis.
3. Define the start and end time and day of analysis. The number of trips on network segments within this time frame is used to measure the service level.
6. Click Save and Run Analysis. You will be notified when the analysis is complete.
Interpreting results
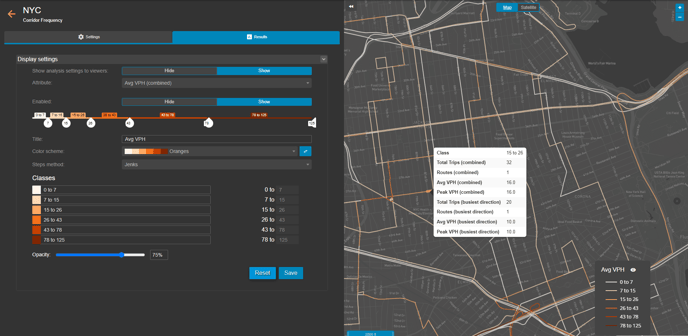
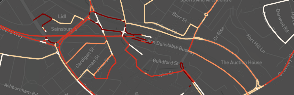
The visualisation depicts segments on your network, colour-coded by according to the average number of vehicle departures per hour. This can be changed to reflect a variety of other attributes by clicking the 'attribute' dropdown.
Clicking a segment on the map will display statistics for that segment, including:
| Class |
| Total Trips (combined) |
| Routes (combined) |
| Avg VPH (combined) |
| Peak VPH (combined) |
| Total Trips (busiest direction) |
| Routes (busiest direction) |
| Avg VPH (busiest direction) |
| Peak VPH (busiest direction) |
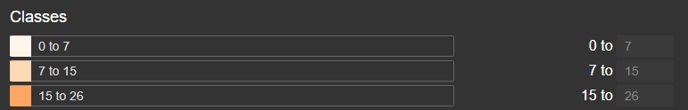
As with PTAL scores, the classes can be defined according to your specifications, either by dragging the classes on the slider:
![]()
Classes can also be added or altered in the classes settings, below.
Exporting results
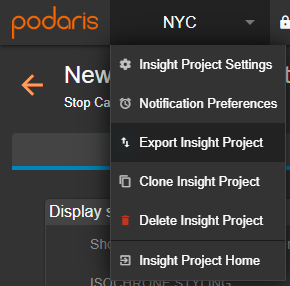
Your analyses can be exported by clicking the project name, and Export Analyse. From here, you can export in a variety of formats, such as GIS and .CSV for either individual or total catchment.