What is Podaris:Insight?
Podaris:Insight is a toolkit for simplifying a number of types of accessibility analysis. It is designed to dramatically speed up the process of performing accessibility analysis on networks and datasets created or imported in Podaris. It provides a simple interface through which analysis projects can be created and shared, and the corresponding results exported. You can learn more about Podaris:Insight and the analysis types that it offers here.
What is the Multi-Criteria Analysis Index type?
The multi-criteria analysis is a method used to evaluate the accessibility of a set of locations based on multiple factors. It allows you to add different criterias to a regular accessibility index and understand how various resourses that are allocated in an area can be reached by the population.
In the settings of your analysis, you will be able to select a base network, determine a dataset with zones to travel from or to that can be uploaded or plotted manually, and establish various accessibility factors. Those factors can also be previously uploaded to Podaris or obtained using an OSM query. Each criteria has a score value that can be weighted according to the importance that you want to give to it. Your analysis can be set to create a score for each point that is reached or for any of those points.
This analysis type is valuable for identifying disparities in access and guide efforts to improve accessibility, particularly for disadvantaged or underserved populations. You can set transport mode as car, cycling, walking or transit within a given maximum duration (or maximum journey time). If you choose to analyse using the transit option, it's possible to configure settings such as departure or arrival time, maximum access distance (how much someone can walk to a transit station and from a transit station) and transfer limits.
Step by step
1. Add basic information such as a name and description that will be visible to viewers of the project.
2 Select a network and a view to be used in the analysis.
3. Add a dataset with zones. This can be plotted manually or uploaded from georeferenced dataset. When you choose to plot it manually, you can have H3 hexagons, square, points or hex as grid options for it.
4. Select routing options to set how individuals or groups can access the factors' points you create. You can establish type of travel as from or to, mode of journey and maximum durantion of travel. When using the transit mode, calendars associated with your networks will be used to inform calculations. Multiple departure times set in depart at can be specified, and Podaris will calculate the best accessibility from those times.
5. Define the different accessibility factors that will be used in your analysis. It's possible to select different locations uploading an existing dataset or sourcing them from OSM using Overpass query.
6. Click Save and Run Analysis. You will be notified when the analysis is complete.
Interpreting results
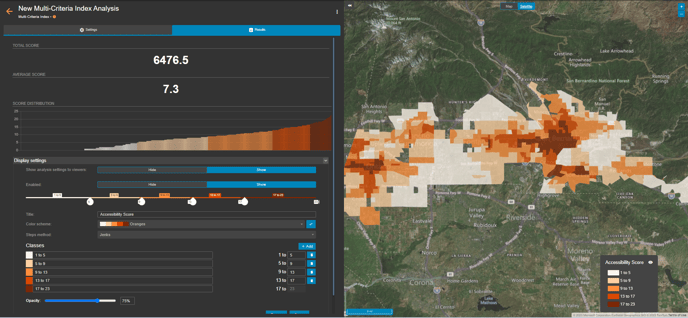
The multi-criteria accessibility index will give to each zone of your dataset the score of points reachable in a given time according to the weight you established for each factor.
The total and average score considers all the covered areas and not just those that are accessible in the same given time.
Exporting results
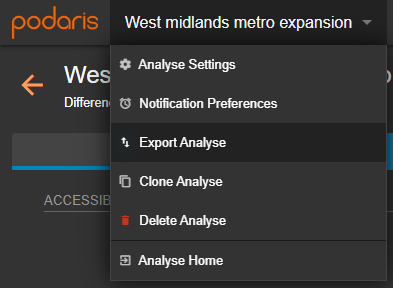
Your analyses can be exported by clicking the project name, and Export Analyse. From here, you can export in a variety of formats, such as GIS and CSV (comma separated values).