![podaris_logo_png.png]](https://support.podaris.com/hs-fs/hubfs/podaris_logo_png.png?height=50&name=podaris_logo_png.png)
In this example, we're working through a proposed development on the edge of an existing town, using its masterplan to build a street network and measure cycling accessibility to schools, hospitals and GPs.
We've taken the proposed street network and used it to answer a specific planning question: how easily can people living in different parts of the development reach key amenities by bike?
Here's the workflow we'll take you through:
Masterplan → street network → amenity datasets → cycling accessibility analysis → a measurable outcome.
Step 1: Bring the masterplan design into Podaris
We start by bringing the masterplan itself into Podaris as a georeferenced tileset. This works by matching known points on the masterplan image to the corresponding points on the map, so the drawing lines up correctly with real-world geography.
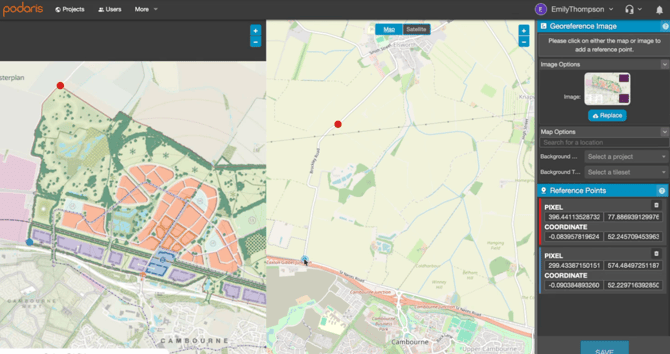
Once saved, the masterplan is available as a tileset layer in any project.
Step 2: Create the proposed street network
Create a new street network by drawing or importing a polygon around your area of interest. Podaris pulls in the existing OpenStreetMap data for that area as a Streets project.
Open the network in Podaris:Plan and add your masterplan tileset as a layer, so the proposed layout sits alongside the existing streets.
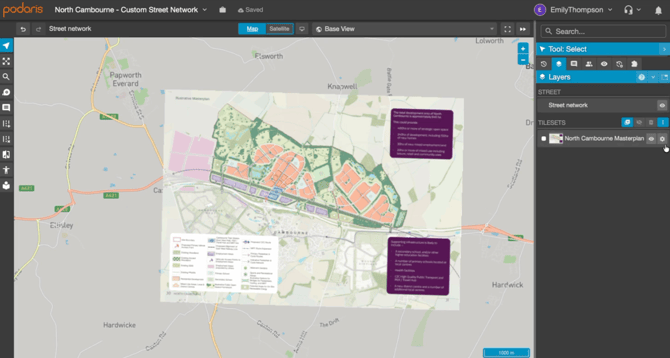
Using the street editor, draw in the main residential streets, footpaths, cycleways, and any proposed bridges or crossings shown on the masterplan.
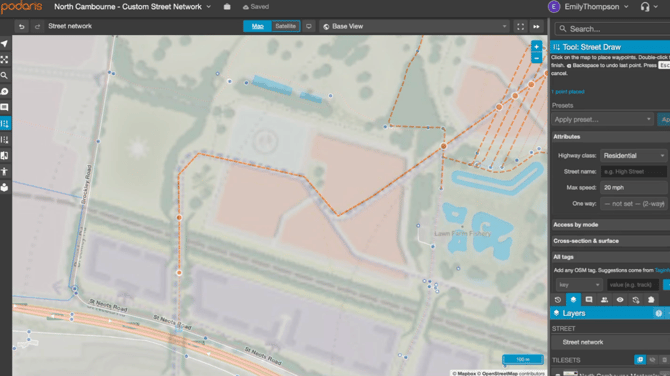
Building it directly in Podaris means the changes take effect immediately, and any planning or analysis run against this project uses the network as it's actually designed, not an approximation of it.
Step 3: Update the amenity datasets
Import or update your datasets for the destinations you're measuring accessibility to. In this example: primary schools, secondary schools, hospitals and GPs.
Add the development's proposed amenities using the draw tool (here, four primary schools and one secondary school) into the relevant datasets, so the analysis reflects what's proposed as well as what already exists.
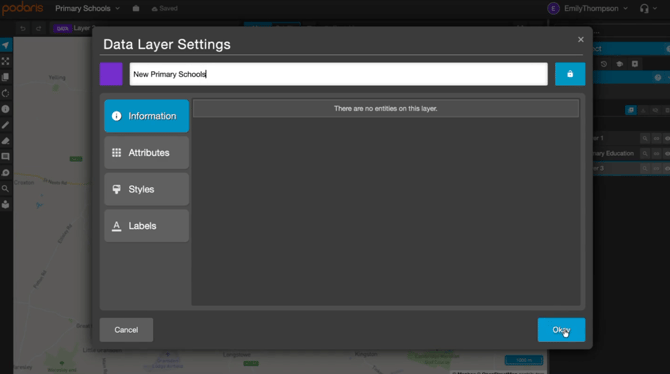
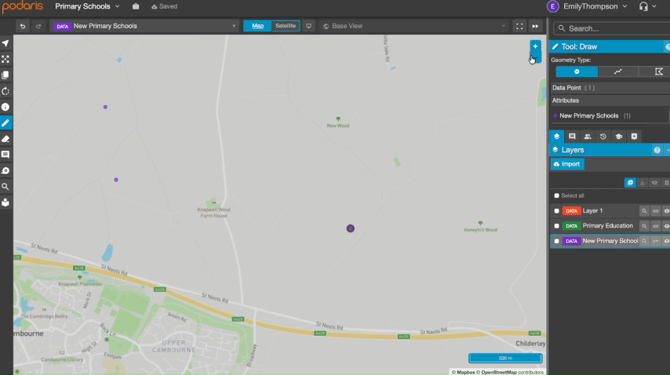
Now our analysis accounts for the full picture: existing amenities plus what the scheme will deliver.
Step 4: Run the cycling accessibility analysis
With the network built and the datasets updated, we apply the street network to a Podaris:Plan project and move into Podaris:Insight to run the analysis.
- Set Location to your origin points within the development
- Set Transit type to cycling
- Set your journey-time bands (10, 20, and 30 minutes)
- Connect your amenity datasets to count how many fall within each band
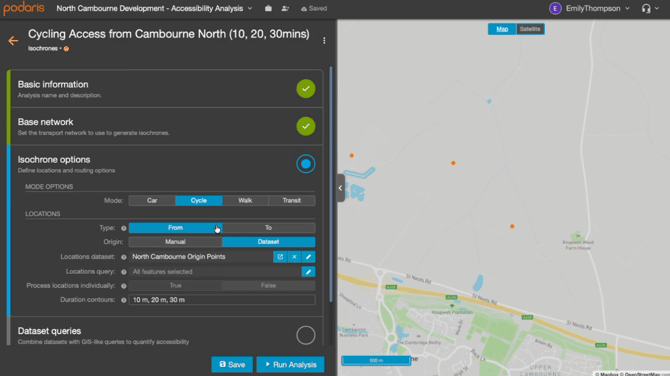
Click Recalculate to generate the cycling isochrones.
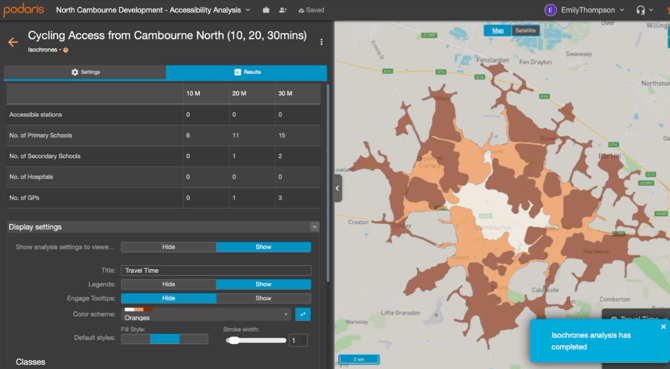
Reading the results
The results show how many primary schools, secondary schools, hospitals and GPs fall within each cycling journey-time band, for each origin point.
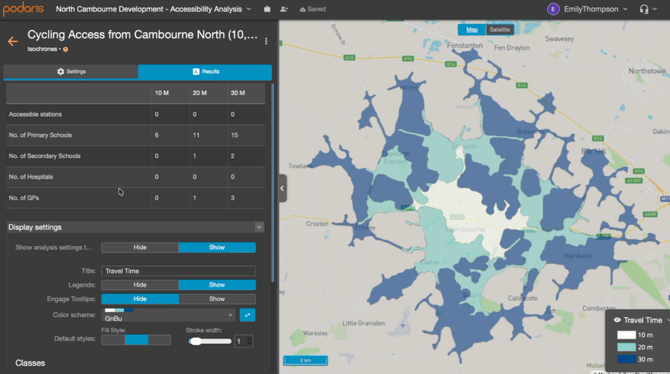
The same approach works for other modes (walking, public transport) and other destination types (rail stations, supermarkets, employment sites).