The Analyst Tool allows you to generate outputs based on your networks, services and simulations and create at-a-glance visualisations based on a variety of analysis types.
Clicking the Analyst Tool button on the tool bar will bring up a variety of analysis options and buttons on the tool properties panel for running analyses, exporting analysis data and clearing the current analysis.
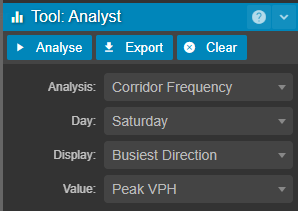
Once you have selected your analysis type and selected the appropriate settings, the Analyse button will begin analysis. The export button will export the outputs in a variety of formats, including GeoJSON, Shapefile and KML.
Corridor Frequency
Corridor frequency analysis can produce at-a-glance segment-by-segment overviews of either:
- The number of vehicles per hour (Peak VPH) operating on a segment
- The Number of Services (unique routes) operating on a segment
- The Average VPH operating on a segment (the project clock sets the time range in order calculate the average here).
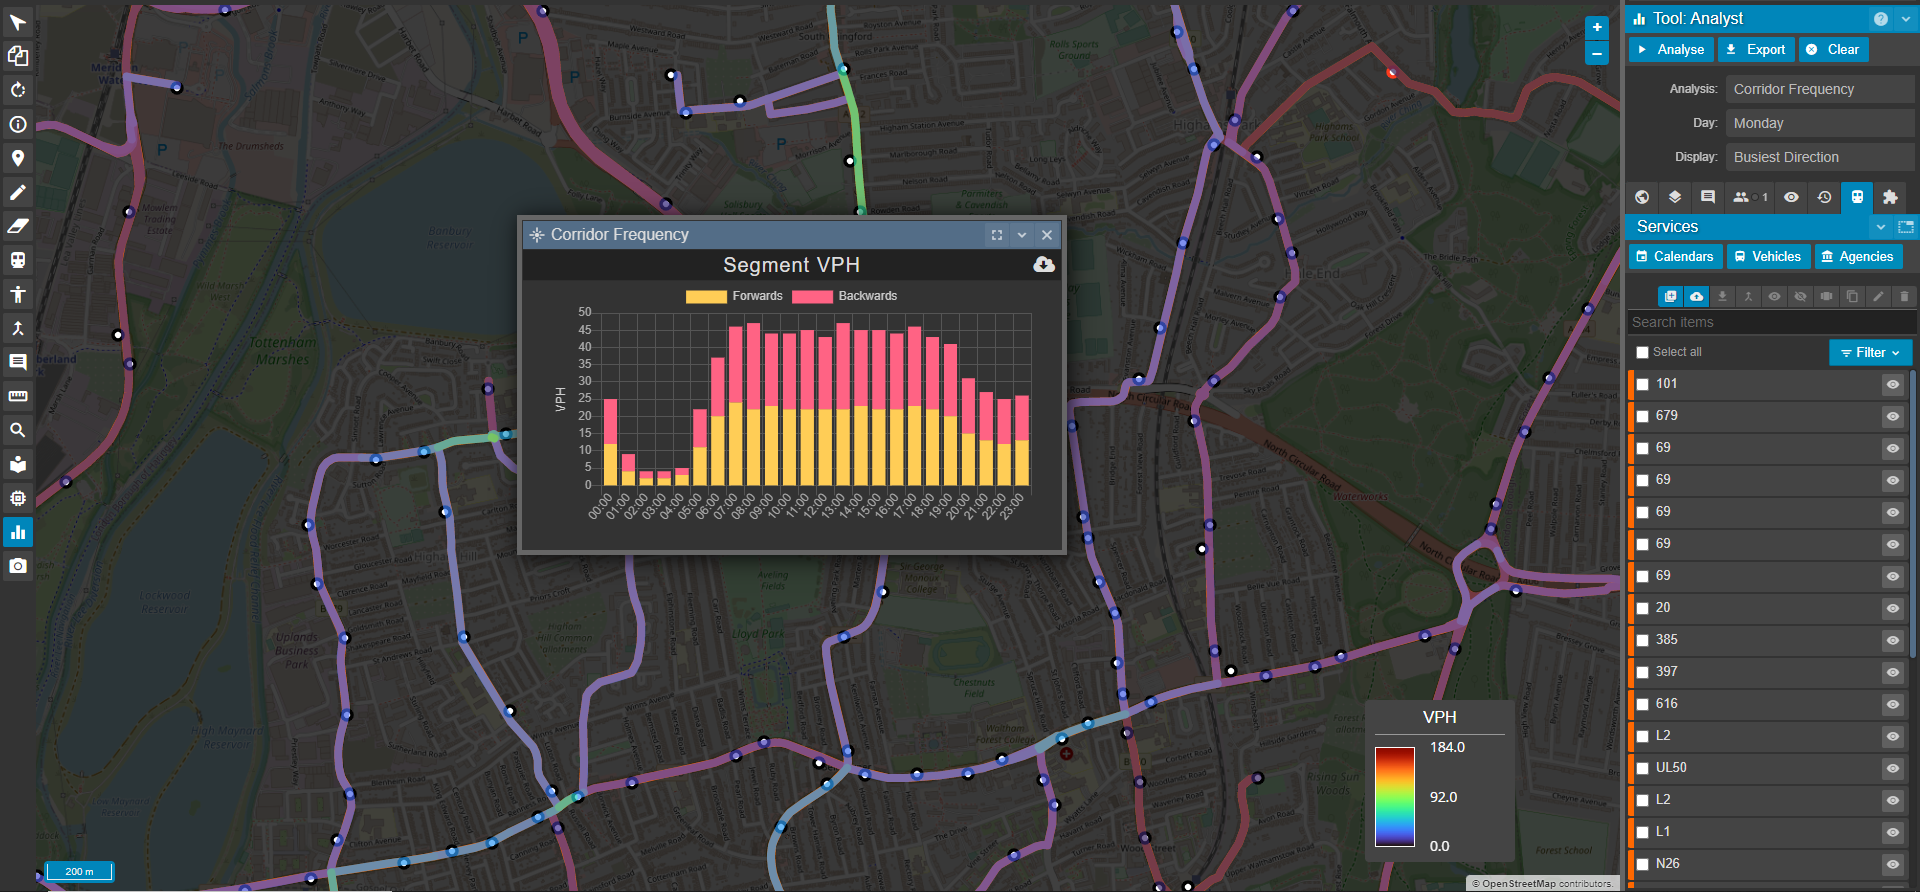
The Value dropdown list allows you to select which of these you would like displayed. The legend displayed in the bottom-right corner of your map indicates the VPH or number of services value associated with each segment's colour.
The day used for analysis can be set according the dropdown Day list.
The colour-coding of your routes can be set to represent either the busiest direction or for combined directions.
Clicking  will allow you to export a GeoJSON, Shapefile or KML file which contains a services field - this corresponds to the Podaris IDs for the services on that segment.
Podaris IDs can be found by exporting a CSV of key statistics for each visible and active route using the  button on the Active Transport Services window, accessible by the
  button the Overview Panel.
The value field of the exported file contains the total number of routes that use that segment.
Note that some roads may be analysed as a one-way road in each direction, whereas others will be analysed as two-way based on the street network used.
Segment Vehicle Per Hour
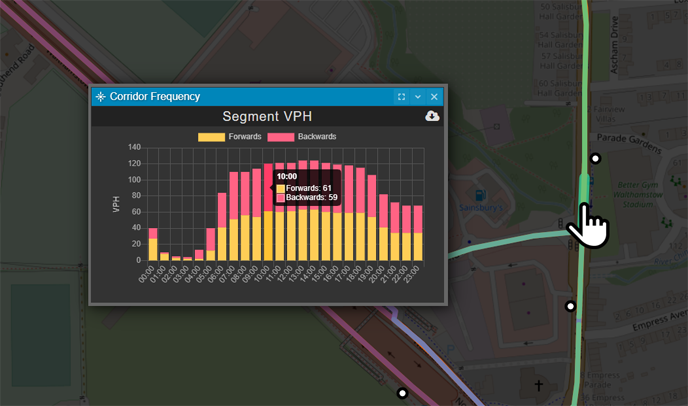
Clicking an individual segment will bring up the Segment Vehicle Per Hour graph, where you can view more detailed statistics for each segment. Hovering over a bar will produce exact values for the given hour on the day chosen in your preferences.
The download button ![]() allows you to export these hour-by-hour statistics as a .csv file.
allows you to export these hour-by-hour statistics as a .csv file.
Clicking the graph and selecting 'save image as...' will allow you to download a raster image of the graph itself. It can be scaled before downloading by clicking and dragging the corner of the Corridor Frequency window to resize it.
Route Speed
The Route Speed analysis type allows you to view the average route speed between each stop based on the distance and duration between stops.
This can be achieved with the Analyst Tool in the following way:
- Select Route Speed as the analyst type.
- Select the route, pattern and direction you wish to analyse.
- Select Average or Difference mode. Difference mode allows you to compare the route speed between different timings by changing mode to difference and selecting the timing(s) that you wish to compare to. This allows you to compare RTI/AVL speeds to timetabled speeds or compare the speeds at different times of the day.
- Select timing(s).
- Click Analyse.
The stopwatch button  on the patterns tab of the services panel also allows you to perform this action on specific patterns,
Stop Frequency
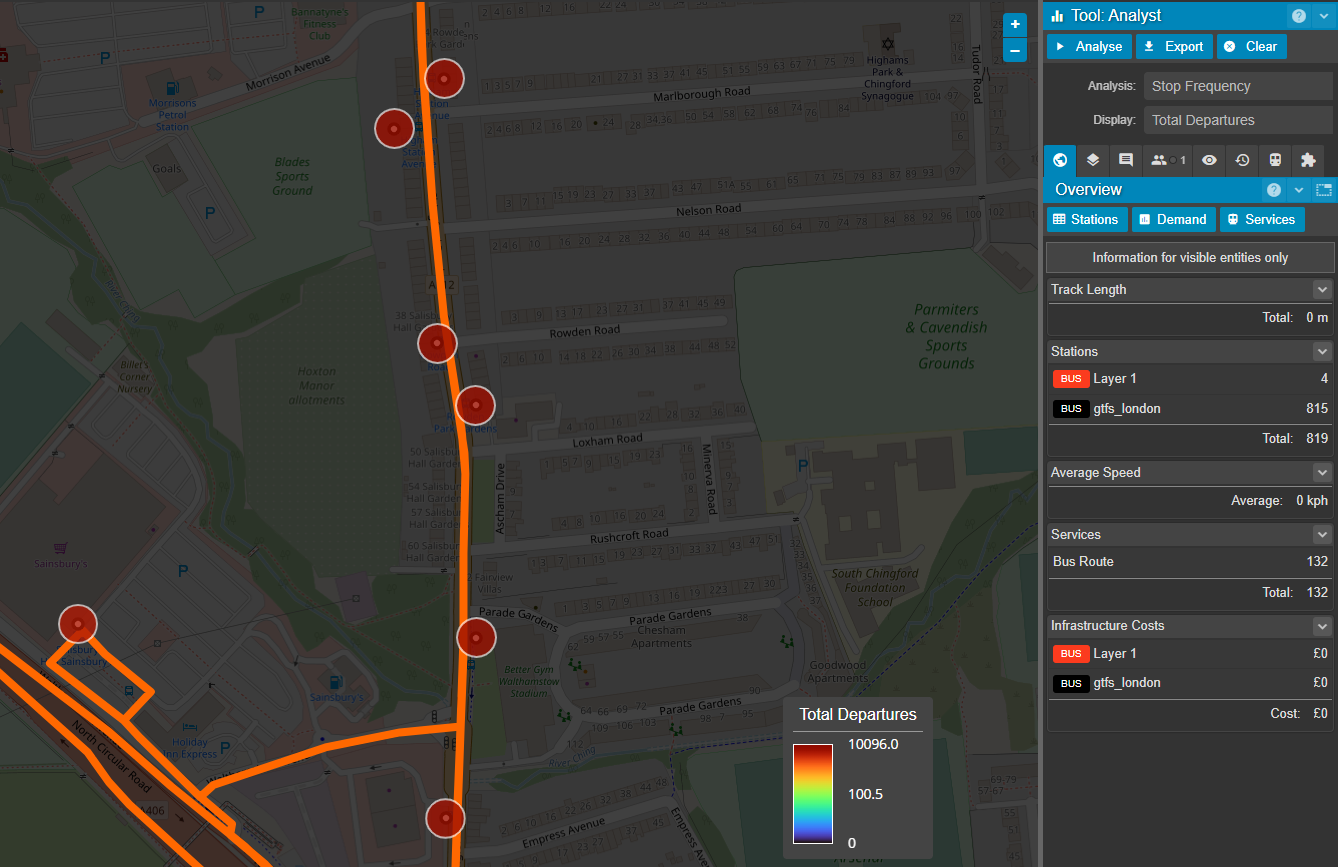
Stop Frequency analysis will produce statistics for all stops (stations) within your project. These statistics take into account the day/date selections made in your project clock.
There are three types of display for this analysis:
- Total departures - the number of vehicles stopping at each station.
- Average VPH - the average number of vehicles stopping at the station per hour.
- Peak vehicles - the maximum number of vehicles stopping at the station.
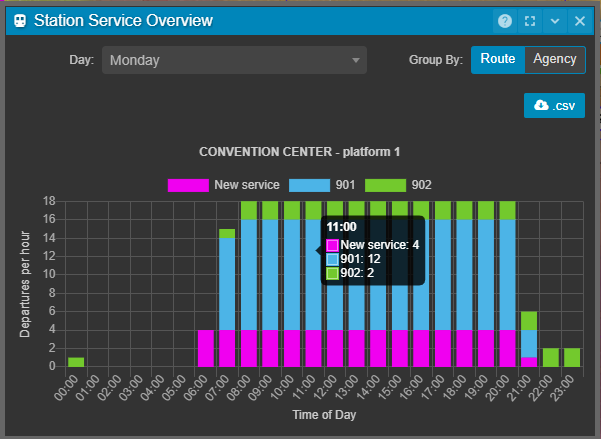
Clicking a station while in this mode is an alternative way of bring up the Station Service Overview panel on which departures per hour can be viewed according to route or agency on a given day, and exported using the .csv button. Hovering over the bar for a given hour will produce more detailed statistics.
Clicking items from the legend above the chart will enable/disable them.