When you use the Select Tool to select one or more stations, Podaris will show you the visible routes which call at those stations in the active tool panel:
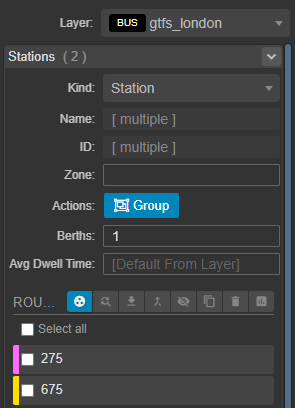
The routes shown can either be the union ( ) of all of the visible routes which call at least one of the selected stations, or they can be filtered to be the intersection (
 ) of routes which call at all selected stations.
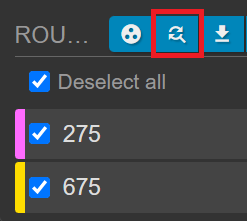
From within this panel, you can apply the same bulk actions found in the services panel to routes, such as merging, exporting, and deleting them.
When there is only one station selected, the chart button ( ) will be enabled, and allow you to open the Station Service Overview panel.
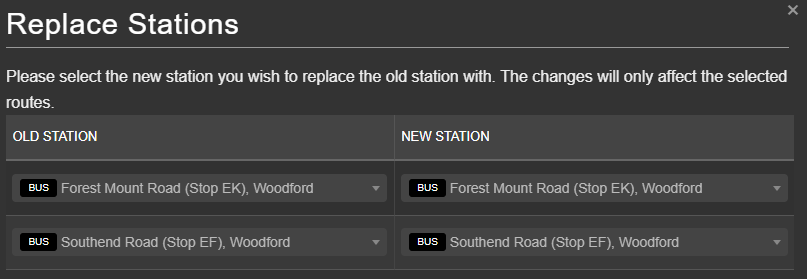
Replacing Stations
The replace stations button allows you to replace selected station(s) on the route or routes of your choice with any other station(s). This can be useful for quickly creating detours and diversions.
Station Service Overview
The station service overview panel provides an at a glance view of the service frequency by route or agency for a single station:
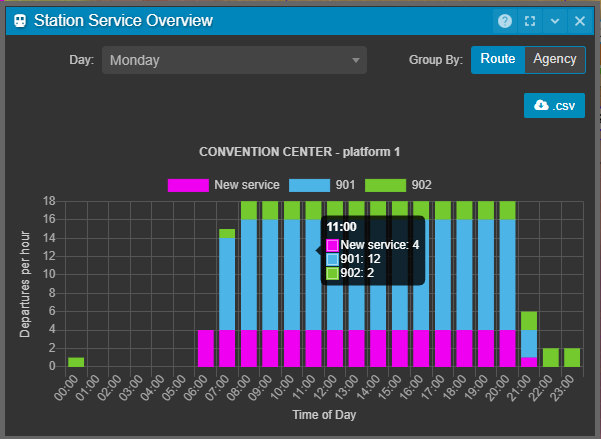
Inside this panel, you can see the number of vehicles per hour which call at the selected station on a given day, either grouped by route or by the agency. This allows you to quickly identify peaks or gaps in the schedule. Hovering over the bar for a given hour will produce more detailed statistics and the .csv button allows you to export this data.
Clicking items from the legend above the chart will enable/disable them.
Tip: by combining the use of the project clock with the Station Service Overview you are able to quickly identify irregular days of service where stations are over/underserved.