In this example, we're going to explore travel times to hospitals within Leeds, England. By connecting census data, we can understand how many people with long term health conditions are able to travel to these hospitals within 30 minutes by walking.
1. Importing location data for amenities
First, we're going to import a dataset generated by querying OpenStreetMap data. Using the Overpass Turbo tool, we create a wizard with the term:
amenity=hospital in Leeds
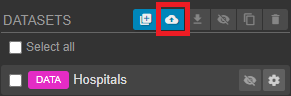
After running the resulting query, we export the data as a GeoJSON file. We can then import this data from the layers panel by clicking the import dataset layer button.
2. Creating an isochrone location by query
Clicking on the ![]() button on the toolbar opens the isochrone tool. Click anywhere on the map to establish an initial isochrone and bring up the isochrone controls.
button on the toolbar opens the isochrone tool. Click anywhere on the map to establish an initial isochrone and bring up the isochrone controls.
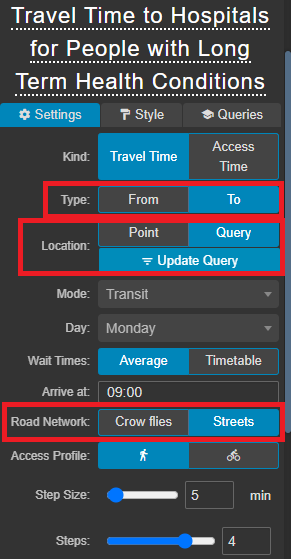
Change the following settings from their defaults:
- Set Type to To (as we're travelling to hospitals from the locations we will later supply)
- Set Road Network to Streets. (This means that the isochrone will follow the existing street network rather than use crow-flies radii)
- Set Location to Query, then click Update Query.
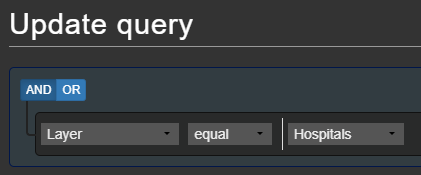
- Select Layer, equal and Hospitals (or whatever you have chosen to call the imported dataset layer) to select all entities on our recently imported data.
- Click "Update" to update the query.
- Click "Recalculate" to create the new Isochrone. Podaris now generates the an isochrone for each hospitals in the dataset.
- Click "Save" to ensure that we can return to this isochrone configuration in the future.
3. Creating an isochrone query based on census data
Next, we source a census-based dataset of people with long-term health conditions in the Leeds area. You can download and use the same zipped GeoJSON dataset here, then upload it in the same way as the hospital dataset above.
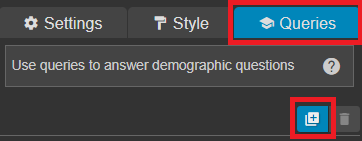
Going back to the Isochrone controls, click the Queries tab, then click the add button to create a new isochrone query:
This brings up the Isochrone Query Editor: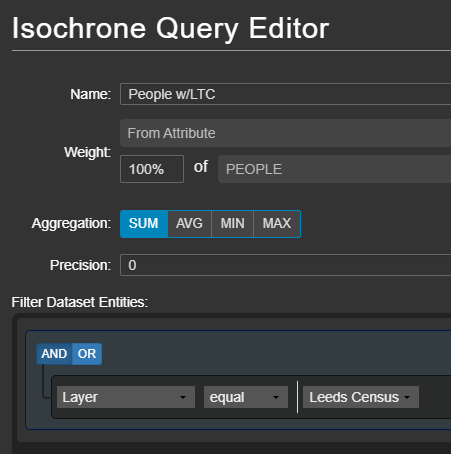
- Set the Name of the query. This will be displayed in the legend on the map.
- Set the Weight to From Attribute. In this case, the dataset has the attribute PEOPLE which is the population of interest
- Set the Aggregation to SUM.
- Under Filter Dataset Entities, set Layer, equal and Leeds Census (or the name of the dataset you imported in this step).
To translate the above, this means that we are taking all entities on the "Leeds Census" layer, and summing 100% of the "PEOPLE" attribute for each entity (or fraction of an entity) which falls within the isochrone time bands.
Once the isochrone query is configured, click Recalculate to see the effects of this query.
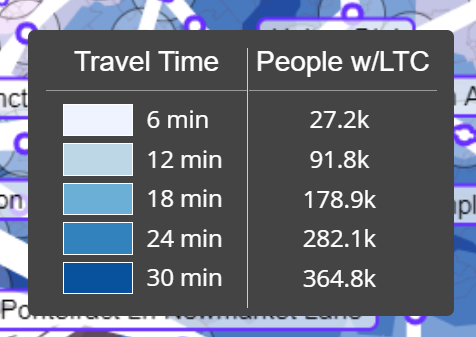
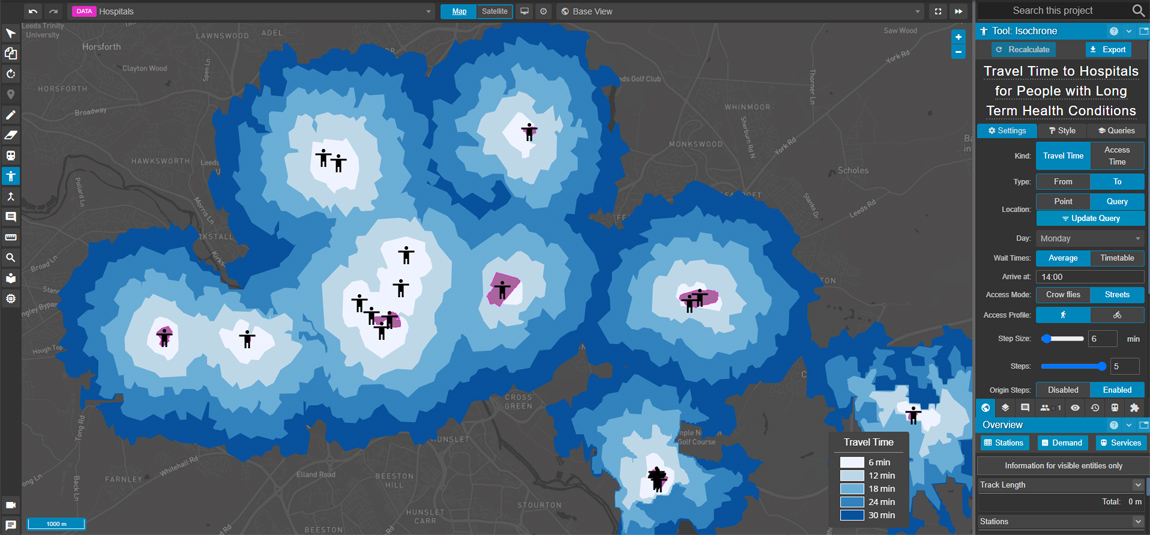
4. Exploring outputs
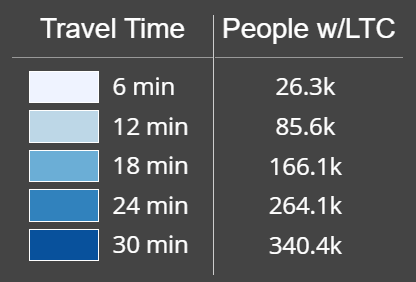
Podaris now automatically calculates the number of people who can reach our hospitals within a range of travel times (set according to the step size and steps that you specified in the isochrone settings earlier).
5. Understanding the effects of transport networks
So far, the isochrone access times are just for walking, since no public transport networks have been added to the project.
While it's always possible to model public transport networks from scratch within Podaris, in this case we are going to add a GTFS feed of the Leeds area.
On the services panel, click the Import button and upload your file.

We can now see the network on our map.
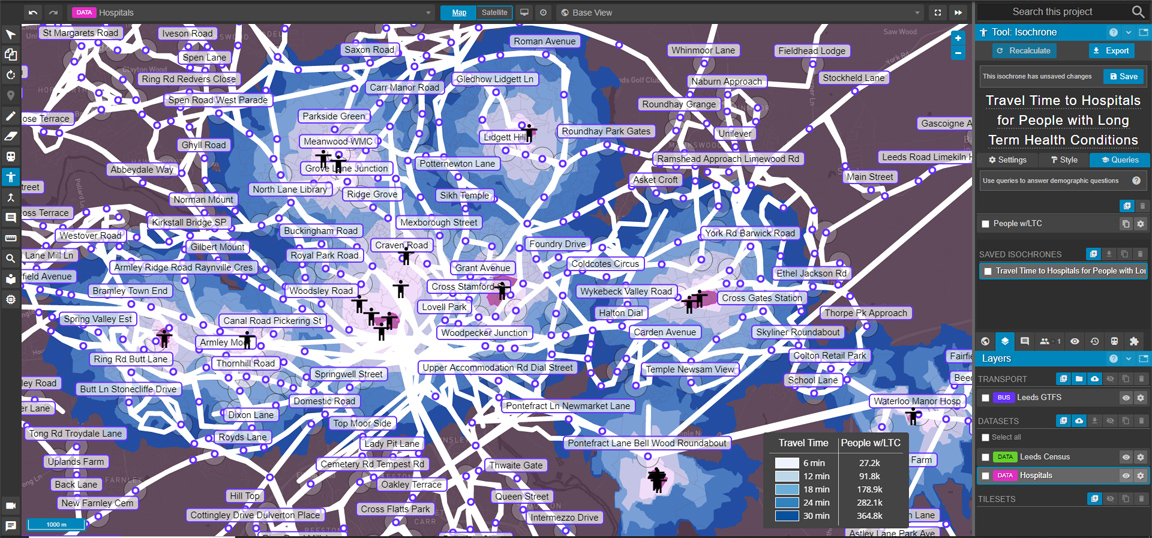
The new calculations with transport network added to facilitate possible journeys are updated and we can see the relative improvements in reachability provided by the transport network.