What is Podaris:Insight?
Podaris:Insight is a toolkit for simplifying a number of types of accessibility analysis. It is designed to dramatically speed up the process of performing accessibility analysis on networks and datasets created or imported in Podaris.
It provides a simple interface through which analysis projects can be created and shared, and the corresponding results exported. You can learn more about Podaris:Insight and the analysis types that it offers here.
What is the PTAL analysis type?
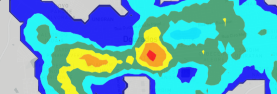
Public Transport Accessibility Level (PTAL) is a measure of how accessible a location is by public transport. It is a scale of 1 to 6 (including sub-divisions 1a, 1b, 6a and 6b), with 6b being the most accessible. PTAL is calculated by taking into account the frequency, speed, and reliability of public transport services within a certain distance of a location.
While PTAL is useful for understanding the density of transport provision, it is limited in that:
- It does not take into account where services actually go, and therefore whether they are connecting people to jobs, hospitals, city centres, etc...
- The cut-off points for transport spots may result in different areas in very close proximity having dramatically different PTAL scores.
How is PTAL calculated?
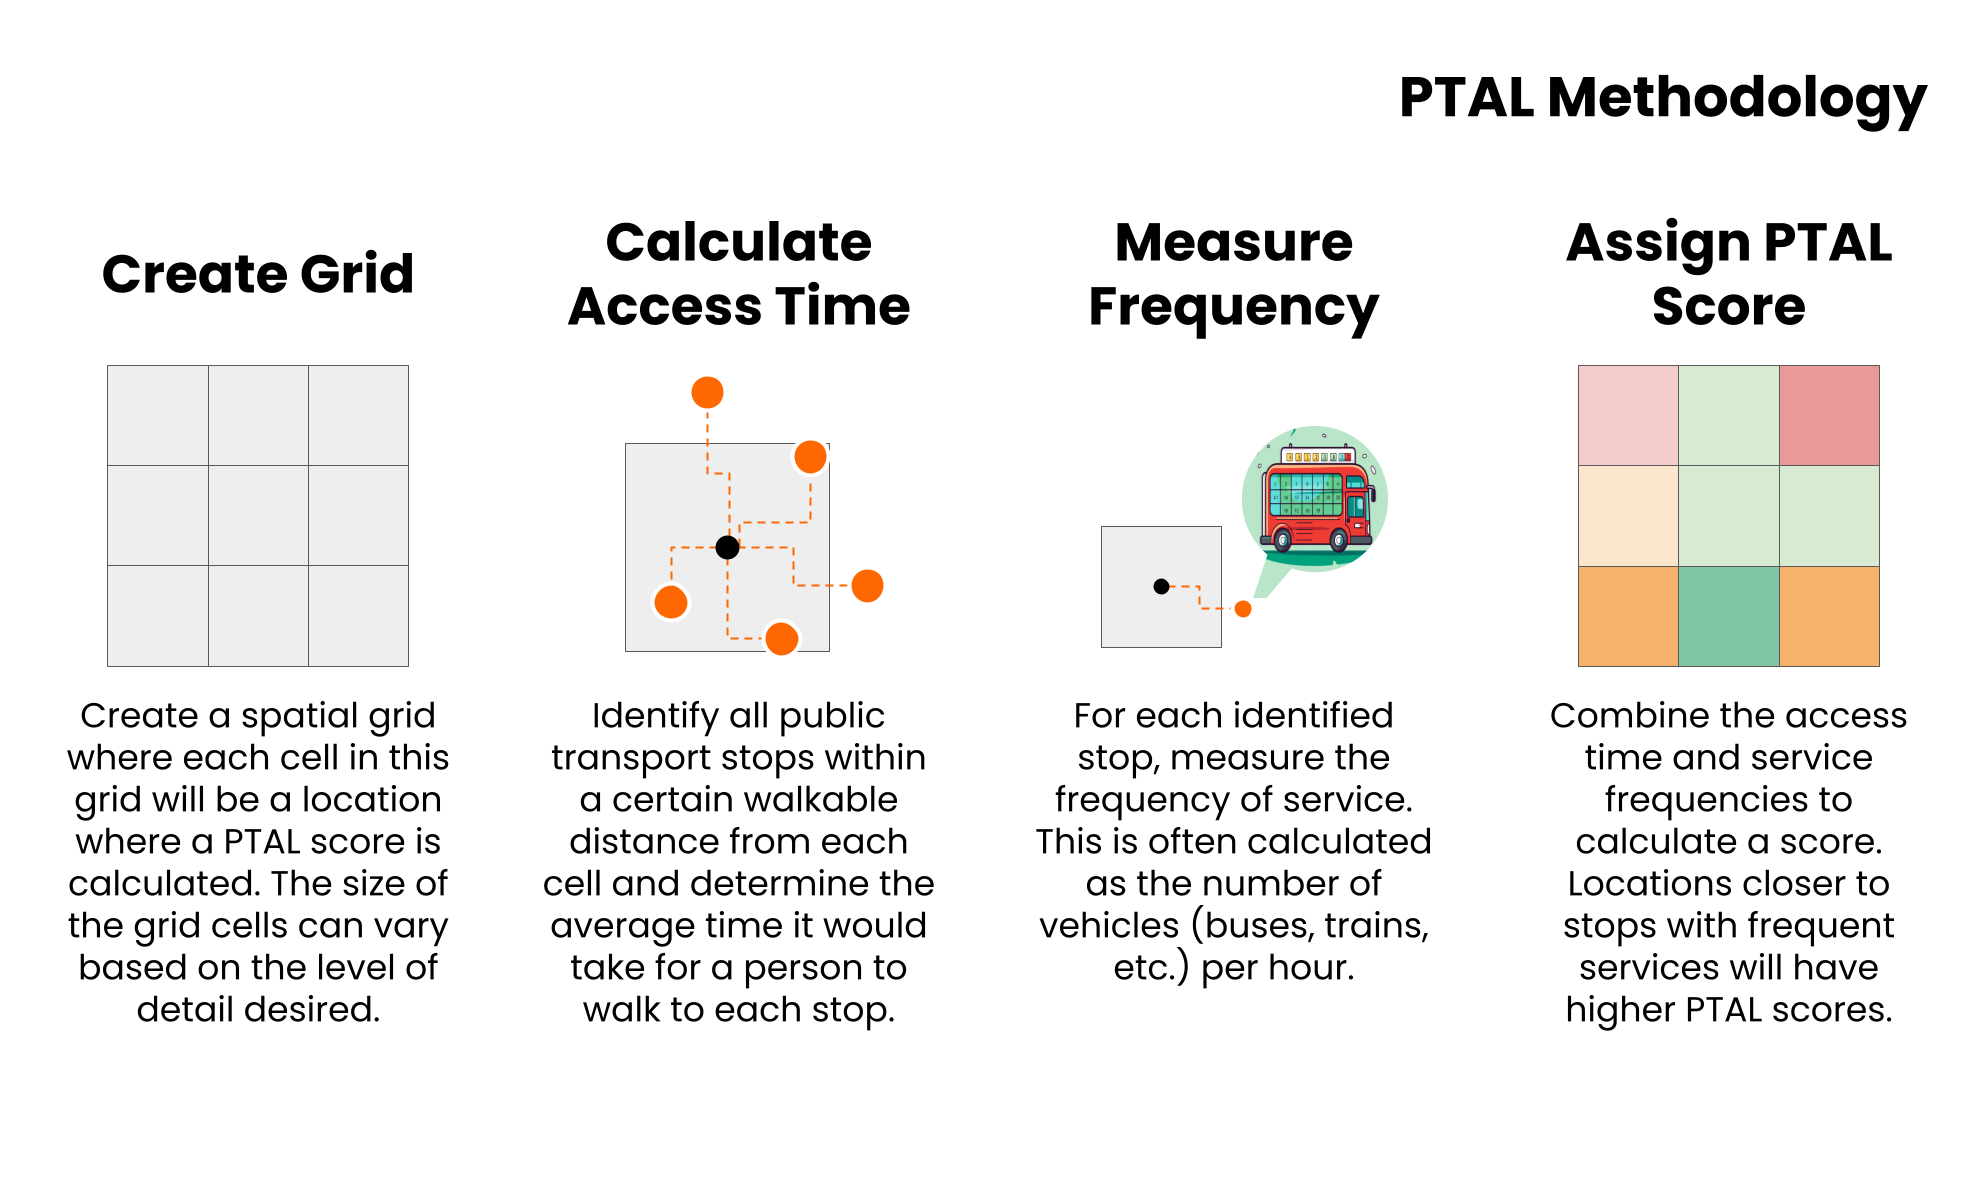
Step by Step
1. Add basic information such as a name and description that will be visible to viewers of the project.
2 Select a network and a view to be used in the analysis.
3. Select a points dataset under PTAL settings. Here, the pencil button will allow you to use an existing dataset or create a new one by clicking the grid icon. Here you can add individual points, which will be given a PTAL accessibility score once you run the analysis. For polygonal features, the centroid will be used a point.
4. PTAL calculations take into account access to public transport stops as well as the frequency of the services at those stops. We must therefore set the time period (day, start and end time) that we want to explore - Podaris then uses the number of departures from accessible stops in its PTAL calculations. A default walking speed (used when accounting for walk time to stops) can be overridden if necessary.
5. Select transport modes and associated settings. The reliability value is used to indicate how 'on time' the mode is, and is added to the average wait time on a stop.
6. Click Save and Run Analysis. You will be notified when the analysis is complete.
Interpreting results
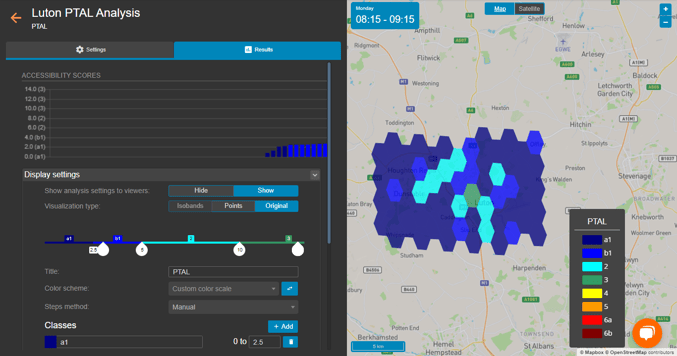
The visualisation and associated legend depicts the PTAL score for the selected area. Individual points (or polygonal entities) can be clicked to find the class and PTAL score for that point. PTAL classes range from a1 (extremely poor accessibility) to 6b (excellent accessibility).
The bar chart shows each point (or polygon), colour-coded according to its PTAL class, with the PTAL score for each viewable when hovering.
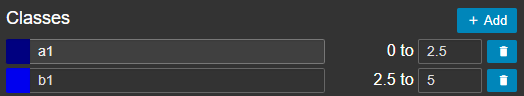
The score range for each class can be set either by clicking and dragging the number under the class:
or by editing the class ranges directly. Here you can also click  to create a new class:
Exporting results
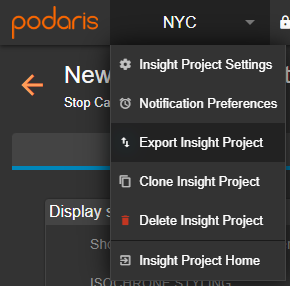
Your analyses can be exported by clicking the project name, and Export Analyse. From here, you can export in a variety of formats, such as GIS and the Podaris format.