
What is Podaris:Insight?
Podaris:Insight is a toolkit for simplifying a number of types of accessibility analysis. It is designed to dramatically speed up the process of performing accessibility analysis on networks and datasets created or imported in Podaris. It provides a simple interface through which analysis projects can be created and shared, and the corresponding results exported. You can learn more about Podaris:Insight and the analysis types that it offers here.
What is Service Catchment Analysis?
Service Catchment analysis allows users to create isochrones for all services of a network in a single command. It allows a easy way to obtain and compare travel-shed areas between different routes in a project and it can be combined with dataset queries, which may be used to perform demographic analysis.

After selecting a base network in the project settings, up to 10 time or distance-based contours can be chosen.
You can specify whether you want your contours to be calculated based on time or distance-contours by setting the "Step type" to your preferred option.
Time-based contours help to answer questions such as "how many people live within a 5-minute walk of a bus stop for each route in my network", whilst distance-based contours answer questions such as "how many people live within 400m of a stop on each of my routes".
Distance-based contours are particularly applicable to bus stop accessibility guidance in the UK, which sets 400m as the maximum recommended walking distance people should live from a bus stop.
The Isochrone Options settings also allow you to filter the network you are analysing to only consider service catchment for routes operating on certain days and at certain times. You can choose between:
- All - Generating service catchment isochrones around every route in your base network
- Day - Generating service catchment isochrones only for routes active on a particular day
- Day and time - Generating service catchment isochrones only for routes active on a particular day and within a particular time frame
Using dataset queries
Datasets can be connected to the analysis in order to quantify accessibility (e.g. to understand accessibility in terms of the population served).
Datasets and their associated queries can be used to answer demographic questions such as "how many more (or fewer) residents have access when the baseline and comparison networks are compared?".
Interpreting results
Service catchment is calculated for every route in your specified network. The service catchment results for each route are presented in a data table in the results tab. Each route's results are presented in their own row in the table, with the columns containing quantitative results for any dataset queries included in your analysis.
The associated map on the right hand side of the screen visually displays the service catchment of a route. You can select which route's service catchment isochrone is displayed on this map by clicking the magnifying glass icon in that route's row; the map will automatically zoom to this route's isochrone. You can also download an individual route's service catchment isochrone by clicking the download icon in that route's row.
The results table contains a search bar that allows you to search for a route in the table by its name. Additionally it contains customisation options that allow you to select which columns you want visible in your results table. Column sorting, which allows you to sort rows from smallest-to-largest (or largest-to-smallest), can be enabled by clicking on the column header you want to sort by.

When to use Service Catchment analysis in Podaris:Insight
Whilst Service Catchment analysis can be performed on individual routes in Podaris:Plan, performing Service Catchment analysis using Podaris:Insight would be more suitable in instances where you need to:
- Analyse service catchment for a large number of distance contours:
Podaris:Insight isochrones allow for more contours (isochrone bands) and the ability to use custom-sized contours (up to 10 contours), giving you greater flexibility when setting your service catchment isochrone parameters. - Analyse individual service catchments for a large number of routes in your network:
Podaris:Insight supports analysis of large networks by enabling you to analyse the service catchment of all routes in a given network simultaneously, and obtain individual service catchment results for each route in the network. This makes Insight better for large network analysis, whilst Plan is more suitable for analysis of a single specific route. - Export isochrone polygons for all routes in your network:
Not only does performing this analysis in Insight enable you to analyse individual service catchments for all routes in a network, but it also enables you to export the analysis (in either CSV, GIS or Podaris format) for all routes in the network at once. This makes it quick and easy for you to continue your large network analysis outside of Podaris if required.
Exporting results
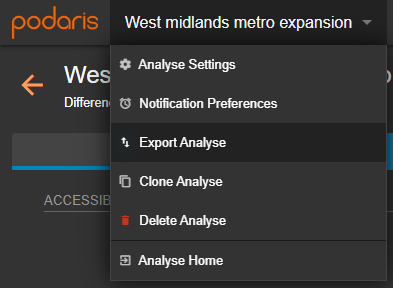
Your analyses can be exported by clicking the project name, and Export Analyse. From here, you can export in a variety of formats, such as GIS and CSV (comma separated values).
Alternatively, if you wish to export the service catchment isochrone of one particular route, you can do this directly through the download option in the results table (as mentioned in the Interpreting Results section above).