
What is Podaris:Insight?
Podaris:Insight is a toolkit for simplifying a number of types of accessibility analysis. It is designed to dramatically speed up the process of performing accessibility analysis on networks and datasets created or imported in Podaris. It provides a simple interface through which analysis projects can be created and shared, and the corresponding results exported. You can learn more about Podaris:Insight and the analysis types that it offers here.
What is Service Distance Analysis?
Service Distance Analysis is a tool for assessing the accessibility of public transport stops relative to the areas with high demand or high need. Specifically, it helps determine which existing stops to enhance or where new stops should be placed based on demand data, such as the number of pass holders within a given postcode who are eligible for free school travel.
Some key use cases for the Service Distance Analysis include:
- Identifying underserved areas with high demand
- Conducting accessibility audits for public services
- Evaluating equity of jobs access
Step by Step
- Add basic information such as a name and description that will be visible to viewers of the project.
- Select a network and a view to be used in the analysis.
- In the Locations options:
- Select a locations dataset that contains the locations for which proximity to stops will be analysed. This dataset needs to have first been uploaded to Podaris as a separated dataset project to be accessed by Insight. For more information on this read our article here.
- Set the location name field. This corresponds to the ID that will enable you to identify each location and search for it in the results table. For example, if analysing service distance of postcode points to stops the name field would be set to the postcode.
- Set the location numeric field. This represents a numeric value attached to the location points - for example number of bus passholders at each postcode or number of employees at each employment location. Adding this will enable you to see how well locations which are likely to generate high public transport demand, or should be prioritised for public transport access, can access a stop in your network.
- Set the distance steps that will be used to define the size of the isochrone contours for your analysis.
- When happy with all of your settings, click Save and Run Analysis. You will be notified when the analysis is complete.

Interpreting results
The analysis process includes generating distance-based walk isochrones for each location's centroid. An isochrone is a contour that represents the maximum walking distance from a central point (i.e. a postcode area centroid). By creating isochrones, the analysis can calculate the accessibility of each stop for users within a defined walking distance.- Generating Isochrones: A walking distance isochrone is generated from each postcode centroid, defining accessible stops within that distance.
- Calculating Stop Coverage: For each isochrone, the number of accessible stops is calculated, which helps visualize how well each area is served. This can be filtered based on custom criteria, such as high demand or limited access.
- Visualising Results: The map visualisation in Podaris will display the isochrone for a selected postcode, showing the reach of current stops relative to the area's demand. Users can select specific point locations to focus on those that meet specific needs or criteria.
- Chart-Based Analysis: Charts can highlight the areas with the highest counts but the least accessibility to stops, providing a clear visual prioritisation for investment decisions.

Exporting results
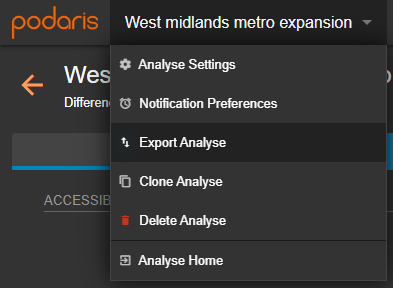
Your analyses can be exported by clicking the project name, and Export Analyse. From here, you can export in a variety of formats, such as GIS and CSV (comma separated values).