This functionality is currently in BETA with selected enterprise customers. To request access please contact support.
Podaris supports integration with Google Sheets, allowing you to export data from your projects and perform computations. The output of these computations can be visualised and presented as charts within Podaris, allowing stakeholders to easily interpret data derived from the modelling of multiple scenarios.
Access to this raw project data allows for further analysis using your preferred tools, and synchronisation between Podaris and Sheets means that changes in your project are reflected automatically.
Syncing data to Google Sheets
To get started, first navigate to the project settings page of the project you would like to connect:
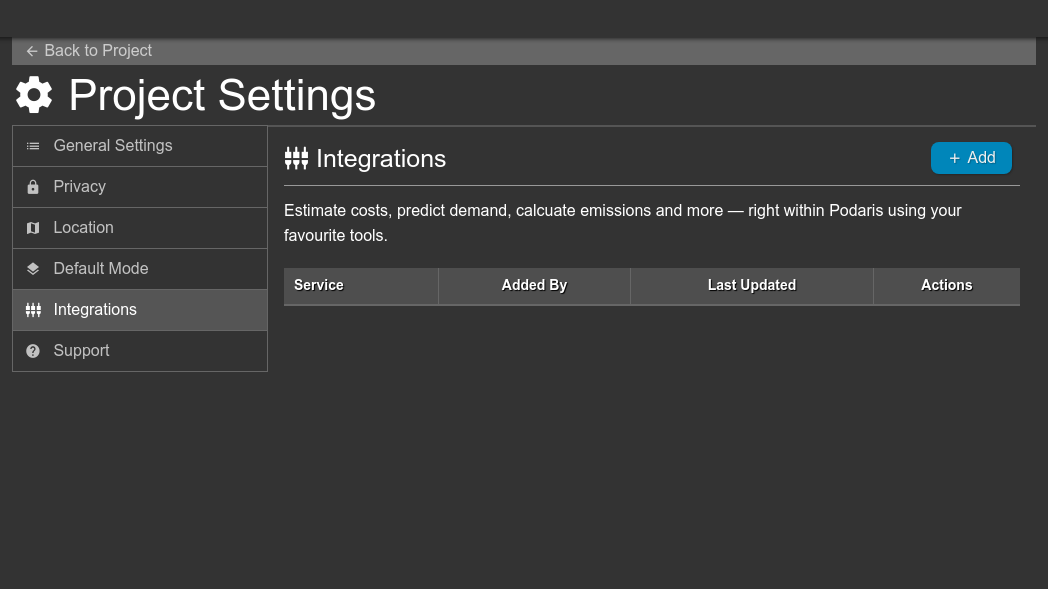
There you will find an integrations tab, where you can select "Google Sheets" from the list. Clicking "Okay" will open the Podaris Google Sheets add-on page in a new window. In order for Podaris to be able to communicate with Google Sheets you are required to install the add-on:
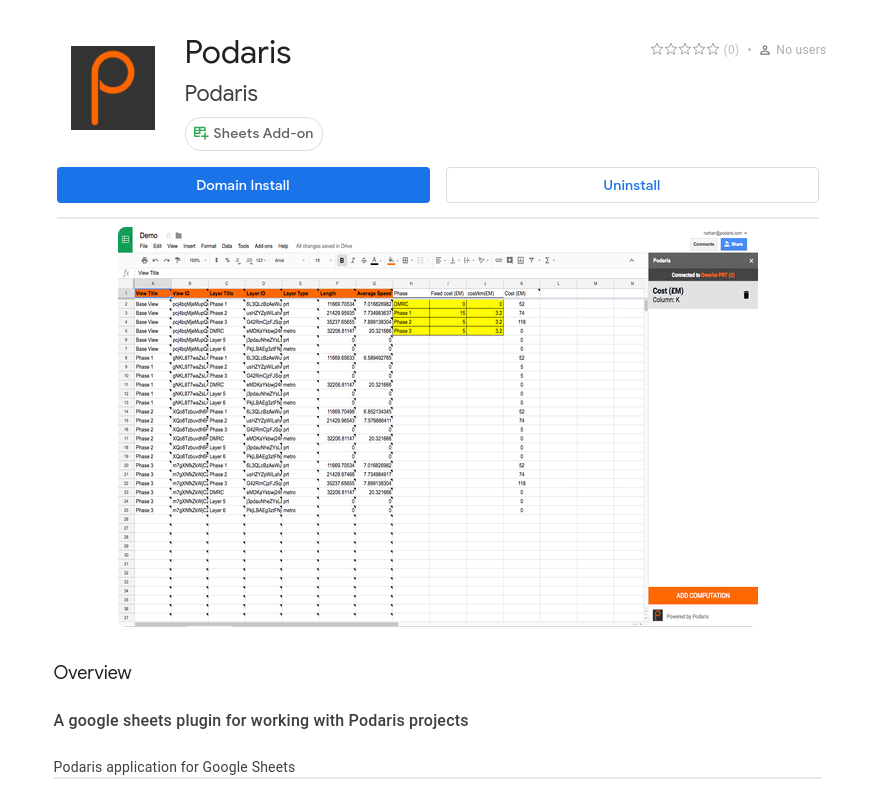
Once installed, open the spreadsheet you would like to connect. In the "Add-ons" menu, there should now be a "Podaris" option. Clicking "open" will begin the process of connecting the current sheet to a project.
After clicking "open", you will be asked to enter:
- The hostname for your Podaris instance
- Your API account key
- The project (which you must be an admin for) that you would like to connect the spreadsheet to
Then Podaris will create a variety of new tabs within the spreadsheet, where different properties such as track length, isochrone results, and scheduled service statistics will be periodically synchronised whenever a change is made in your project.
Please note, it can take a few moments for changes to be synchronised to and from Google Sheets.
Your project should now be connected to this spreadsheet, and you can begin to create complex derived models for arbitrary calculations such as costing or emissions from the live statistics - helping to ensure that your models are never out-of-date.
Syncing data to Podaris from Google Sheets
Once you have connected a Podaris project to a Google Sheet, data should flow from Podaris to the spreadsheet, however, you will often want to also send data in the other direction, back to Podaris. Perhaps to report costs for scenarios, or illustrate core KPIs to stakeholders through Podaris:Engage.
Through the Podaris add-on for Google sheets, you are able to create computations. These computations will be automatically sent to your Podaris project whenever they change, providing a live connection to data.
From within the add-on sidebar you can create new computations. These have a name, and level of grouping. Groups can be used to create different levels of analysis, there are currently two supported groups:
Views
This group option allows you to compute values for each view within a project. For instance, if you have two views "Scenario A" and "Scenario B", the computation could be used to calculate and display the cost of each scenario. After adding a new "views" computation, a new sheet in the document will be created and will begin receiving data, in the structure of:
| View Title | View ID | Computation Value |
| A2 | B2 | C2 |
The view titles and IDs will be automatically synchronised from your Podaris project, but the third column, column C, is where you can begin entering your calculations. Since the view titles and IDs may change as views are added and updated, it is best to use formulas which reference the values in column A and B. As an example, if you wanted to calculate the cost of each view based on the track length, you could use a formula such as:
SUMIF('[Podaris] Layers'!B:B,B2,'[Podaris] Layers'!H:H) * cost_per_meter
Whenever the values of your computation update, they will then be synchronised to Podaris, where you can see them displayed within Podaris:Engage as a chart:
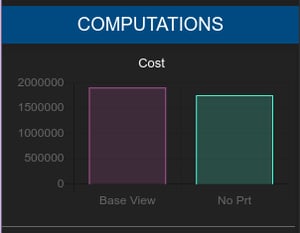 Each views-based computation will appear in Podaris:Engage in every view.
- The columns in the chart will be the titles of all of the views which are visible to viewers.
- The value of each column is the raw unformatted value from within column C ("Computation Value") inside the Google Sheet
- When you hover over the columns in the chart, the formatted value from the Google Sheet cell is shown.
Layer Type
Rather than having a single calculated value for each view within a project, the "Layer Type" group option provides another method for showing calculated values.
When you add a new "Layer Type" computation to your Google Sheet, a new sheet is created, and Podaris begins synchronising three columns from your project:
| View Title | View ID | Layer Type | Computation Value |
| A2 | B2 | C2 | D2 |
The view titles, IDs, and Layer Types will automatically be synchronised from your Podaris project. Unlike the "Views" computation, an additional Column C (Layer Type) has been added. This will be based on the layer types present in your project and provides a way for you to calculate specific values. For instance, you may want to showcase the cost of a PRT system vs a bus based on number of stations, within the same view. You could use a formula such as:
SUMIFS('[Podaris] Layers'!L:L, '[Podaris] Layers'!B:B, B2, '[Podaris] Layers'!E:E, C2) * IF(C2 = 'bus', cost_per_bus_stop, cost_per_prt_stop)
Whenever the values of your computation update, they will then be synchronised to Podaris, where you can see them displayed within Podaris:Engage as a chart:
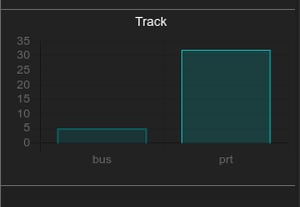 These charts will only display values of layer types within the current view. This means that as you navigate views, the chart will change.
- The columns in the chart will be the names of the layer types from column C ("Computation Value").
- The value of each column is the raw unformatted value from within column D ("Computation Value") inside the Google Sheet
- When you hover over the columns in the chart, the formatted value from the Google Sheet cell is shown.
Please note, it can take a few moments for changes to be synchronised to and from Google Sheets.
Coming soon
There are many other types of outputs and inputs we have planned to provide to Google Sheets, and are interested in any potential use cases you may have. Please let us know how you would like to use the Google Sheets integration!