
What is Podaris:Insight?
Podaris:Insight is a toolkit for simplifying a number of types of accessibility analysis. It is designed to dramatically speed up the process of performing accessibility analysis on networks and datasets created or imported in Podaris. It provides a simple interface through which analysis projects can be created and shared, and the corresponding results exported. You can learn more about Podaris:Insight and the analysis types that it offers here.
What is the isochrone analysis type?
The isochrone analysis type allows you to specify a base network, locations to travel to or from, transit types, and (optionally) datasets and associated queries (which may be used to perform demographic analysis, for example).
The coloured visual bands indicate the distance accessible within increments of time that you specify as duration contours. This analysis type can be used to discover the locations reachable by car, cycling, walking or transit within the specified timeframes.
When transit is selected, options such as transfer limits and departure times are available from during setup. Multiple departure times may be provided, and Podaris will calculate the best accessibility from those times.
At least one location must be specified as a to or from location - however multiple locations can be added either manually or uploaded in the form of a geospatial data file (e.g. geojson).
When to use Isochrone analysis in Podaris:Insight
Isochrone analysis in Podaris:Insight has several advantages over isochrone analysis performed in Podaris:Plan:
- Insight isochrones allow for more contours (isochrone bands) and the ability to use custom-sized contours (up to 10 contours).
- Multiple departure times can be set - Podaris will calculate the best accessibility from these times.
- A simplified user interface for ease of use and ease of sharing results with stakeholders
- Support for analysis of larger networks
- Exported isochrone polygons are automatically dissolved
Using dataset queries
Datasets and their associated queries can be used to quantify accessibility and answer demographic questions such as "how many people live within a 40 minute walk of the hospital?".
Step by Step
1. Add basic information such as a name and description that will be visible to viewers of the project.
2 Select a network and a view to be used in the analysis.
3. Add at least one location. This can be plotted manually or uploaded. These will be either the origin or destination points for your isochrones, depending on whether from or to is selected in as the 'Type' under Transit Options.
4. Select associated isochrone options. Define up to 10 duration contours - the concentric time bands used in your isochrone visualisation. When using the transit mode, calendars associated with your networks will be used to inform calculations. Multiple departure times set in depart at can be specified, and Podaris will calculate the best accessibility from those times.
5. Add a dataset and an associated query if you wish to quantify accessibility.
6. Click Save and Run Analysis. You will be notified when the analysis is complete.
Interpreting results
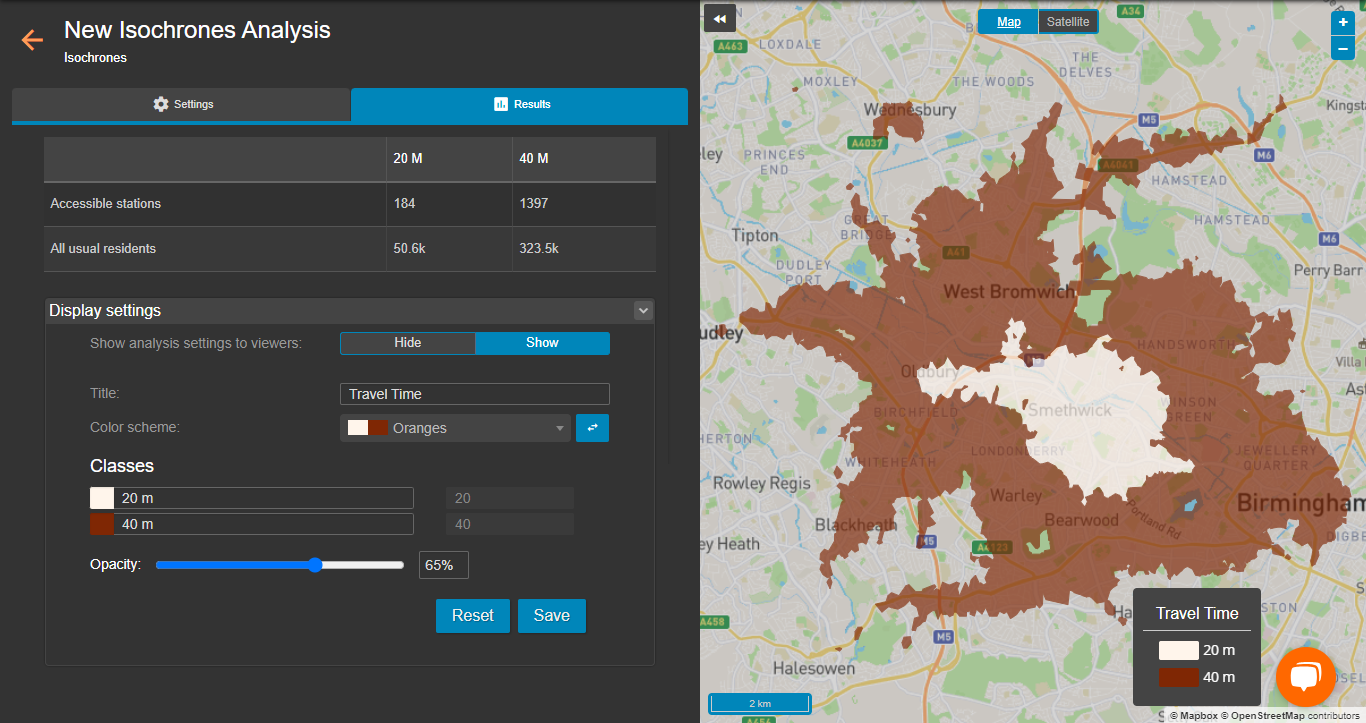
The results page displays the number of stations accessible within the duration contours specified during setup. It also displays calculations of any dataset queries constructed during setup. The legend on your map indicates which colours relate to which duration contour and the isochrone itself depicts the areas that can be reached to or from your set locations in the displayed timeframes.
Exporting results
Your analyses can be exported by clicking the 3 dots at the top of the results page and clicking export analysis.

From here, you can export in a variety of formats, such as GIS and CSV (comma-separated values). If you have set the "process locations individually" setting to "true", you will also see the option to export your isochrones individually in both GIS and CSV formats.
