Trips belong to routes, and are used to define service levels for different patterns or days/times.
Like everything in Podaris they are fully interactive, allow you to explore things like changes in fleet sizes, frequencies, or service departure times. In turn, helping you understand things like fleet requirements, average wait times, and potential route capacities.
Trips are comprised of four key settings:
- Pattern - this determines where physically a route will travel and which stops it calls at
- Calendar - this controls which days of the week or specific dates a trip is running
- Vehicle - this is used to understand potential capacities, routing constraints, and light-weight cost-estimation.
- Type - this defines the service level of the trip and is explained below.
Adding Trips
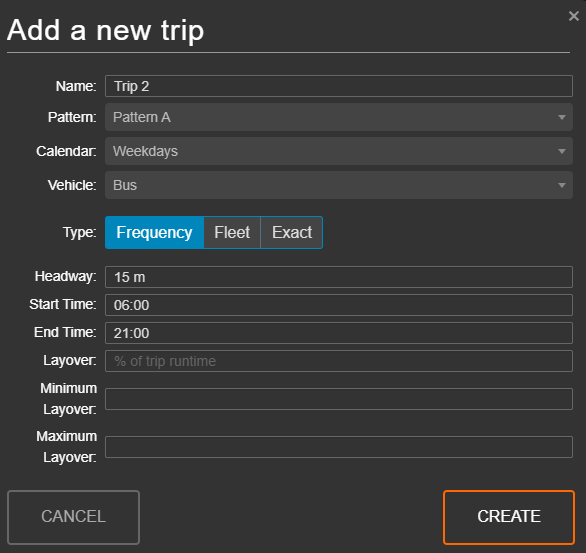
The 'Add a new trip' window comprises a number of options:
- Name, Pattern, Calendar, Vehicle
- Type
- Frequency The trip runs at a frequency specified by the headway and between a user-specified start and end time. An optional Layover (as a percentage of the trip runtime) refers to the wait time at the end of the route before the departure time of the next trip. You may also set a maximum and minimum layover. You can read more about how layovers are used in Podaris here.
- Fleet Start, end and layover times operate as per the frequency type, however, routes are calculated according to a fleet size specified by the user.
- Exact This allows you to specify exact times for trip, separated by a comma. You may optionally specify the Layover for this trip type, also.
- Reopen the ‘Trips’ tab of your route, and click the
 button to begin creating a trip.
 - With the ‘Add a new trip’ modal open, we can select the pattern we created, our ‘Weekdays’ calendar, and the vehicle we created earlier.
- Click CREATE to save the trip. You should see an updated list of trips in the route panel, and the graph should have updated.
Exploring Trip Data
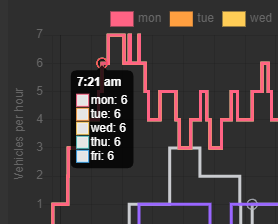
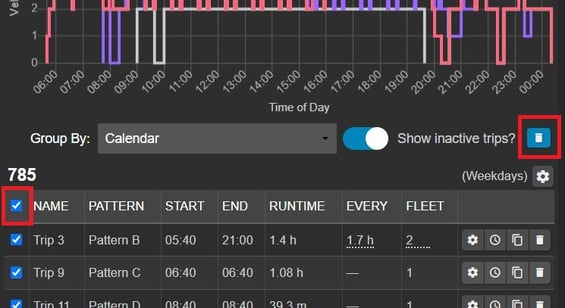
You can hover over any point on the graph to display the values associated with that particular coordinate.
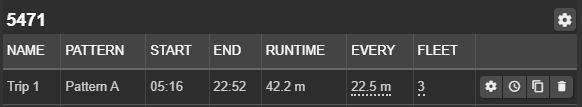
Changes to trips can be made by clicking and editing the following attributes:
- START (the trip start time)
- END (the trip end time)
- EVERY (the frequency of trips made during the specified time window - minutes or hours)
- FLEET (the fleet size)
Changes made to these attributes will be reflected immediately on the graph.
When the inactive trips toggle is selected, inactive trips (i.e. those that are inactive as per the project clock) are greyed out.
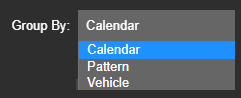
Trips may be grouped in one of three ways: by calendar, pattern or vehicle. When grouped by calendar, the operating days on which the calendar is active are displayed at the top right of the trips table.
Any value in Podaris with a dotted underline (such as START, END, EVERY and FLEET) can be clicked and edited. The editability of these attributes is dependent on what type the trip has been set up as (Frequency, Fleet or Exact).
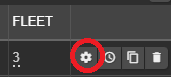
This can be modified on the Update Trip window by clicking the settings button.
Bulk Editing Trips
The Bulk Edit Trips feature lets you update multiple trips at the same time. It’s designed to save time when you need to apply the same change across many trips—such as adjusting frequencies, updating fleet assignments, or changing service details.
Instead of editing trips one by one, you can make all your changes in a single workflow.
How to Bulk Edit Trips
-
Select Multiple Trips
From the trips list, select the trips you want to update by ticking the checkbox next to them. Once trips are selected, an Edit Selected Trips button will appear at the top of the trips list. - Open the Bulk Edit Panel
Click the Edit Selected Trips button to open the editing modal for all selected trips
- Make Changes
Make the bulk changes to the trips that you want to, e.g. adjusting the frequency, start and end times of all of the trips. - Save Changes
Click Save to update your trips to the new settings.
Only fields you change will be updated. Any field you edit is visually highlighted with an orange border, so you can easily keep track of what you are changing.
Understanding "Mixed Values"
If the selected trips you are bulk editing have different values for a particular field, the editor will display a [mixed values] input. This means:
-
The trips don't currently share the same value for that field
- No changes will be made to this field unless you explicitly edit it

Deleting and Duplicating Trips
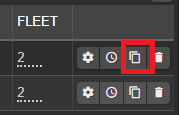
The ![]() button allows you to add a new trip with the parameters of the selected trip pre-populated for easy duplication.
button allows you to add a new trip with the parameters of the selected trip pre-populated for easy duplication.
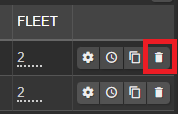
The ![]() button next to a trip allows you to delete individual trips.
button next to a trip allows you to delete individual trips.
The bulk delete button allows you to delete any trips or groups of trips that are selected with the checkbox next to their name.
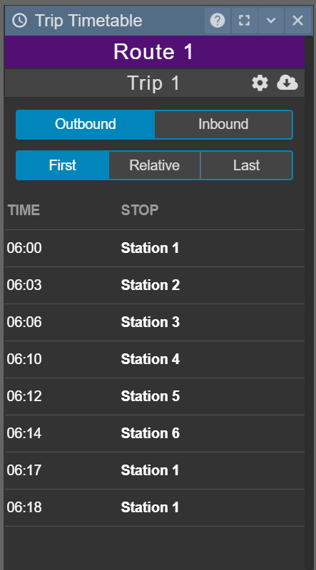
The Trip Timetable
The ![]() button on the trip tab will open the trip timetable, displaying a list of times and stops for the selected trip.
button on the trip tab will open the trip timetable, displaying a list of times and stops for the selected trip.
The ![]() button will open the update trip window.
button will open the update trip window.
The ![]() button allows you to download your trip timetable data in .CSV format.
button allows you to download your trip timetable data in .CSV format.
The Trip Graph
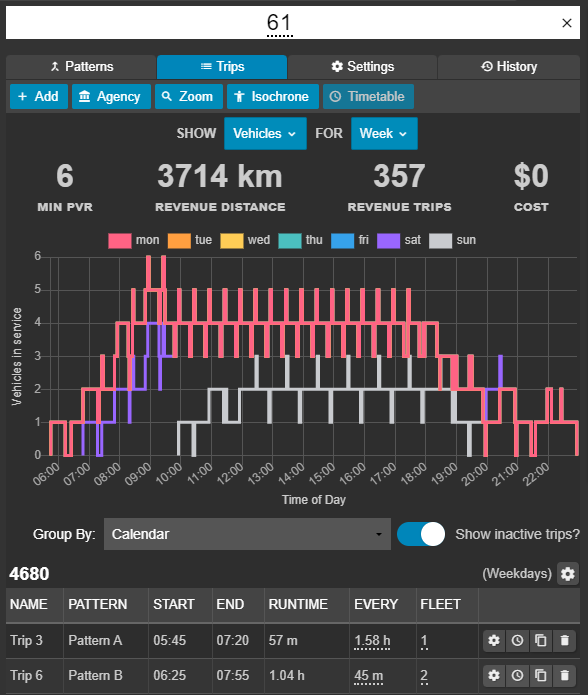
The above buttons allow you to view data as graphs for the following timeframes:
- The week that has been included in your service calendar.
- A particular date.
- A selected day of the week..
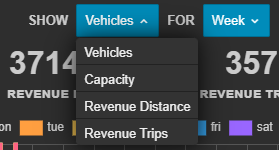
Within these timeframes, a variety of data can be visualised:
- Vehicles per hour vs time of day.
- Capacity vs time of day. Capacity here is calculated as vehicles p/hr * vehicle capacity.
- Revenue distance (the distance the service is running and accepting actual passengers, i.e the distance travelled minus any deadheadings or layovers, in km) vs day of the week.
- Revenue trips. The number of trips made on the route for the selected days, day, or date.
Above this graph, you will also find:
- Minimum peak vehicle requirement.
- Revenue distance.
- A count of revenue trips made on the route.
- Overall cost of the service.
In order to understand how trips function within service scheduling, you can follow the tutorial on creating scheduled services.