![podaris_logo_png.png]](https://support.podaris.com/hs-fs/hubfs/podaris_logo_png.png?height=50&name=podaris_logo_png.png)
These settings can be saved as a view, which can be used for engagement or as guides for yourself and other collaborators.
At the bottom of the panel, Reset to current view settings discards any unsaved changes and returns the display settings to those saved in the current view.
Basemap
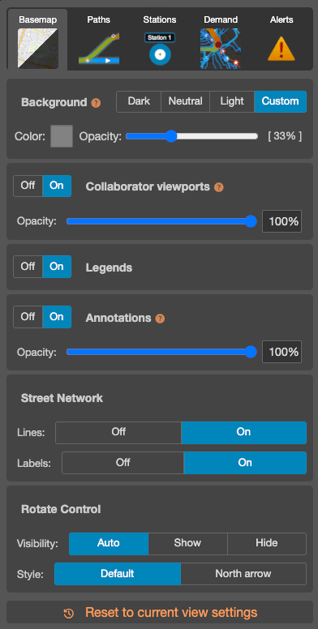
Background
The map background can be blended with a solid colour. Podaris offers several defaults: Dark, Neutral, and Light. You can also specify a Custom background colour and opacity. Together with the options provided in the Map switcher, this allows for a great variety of potential display styles.
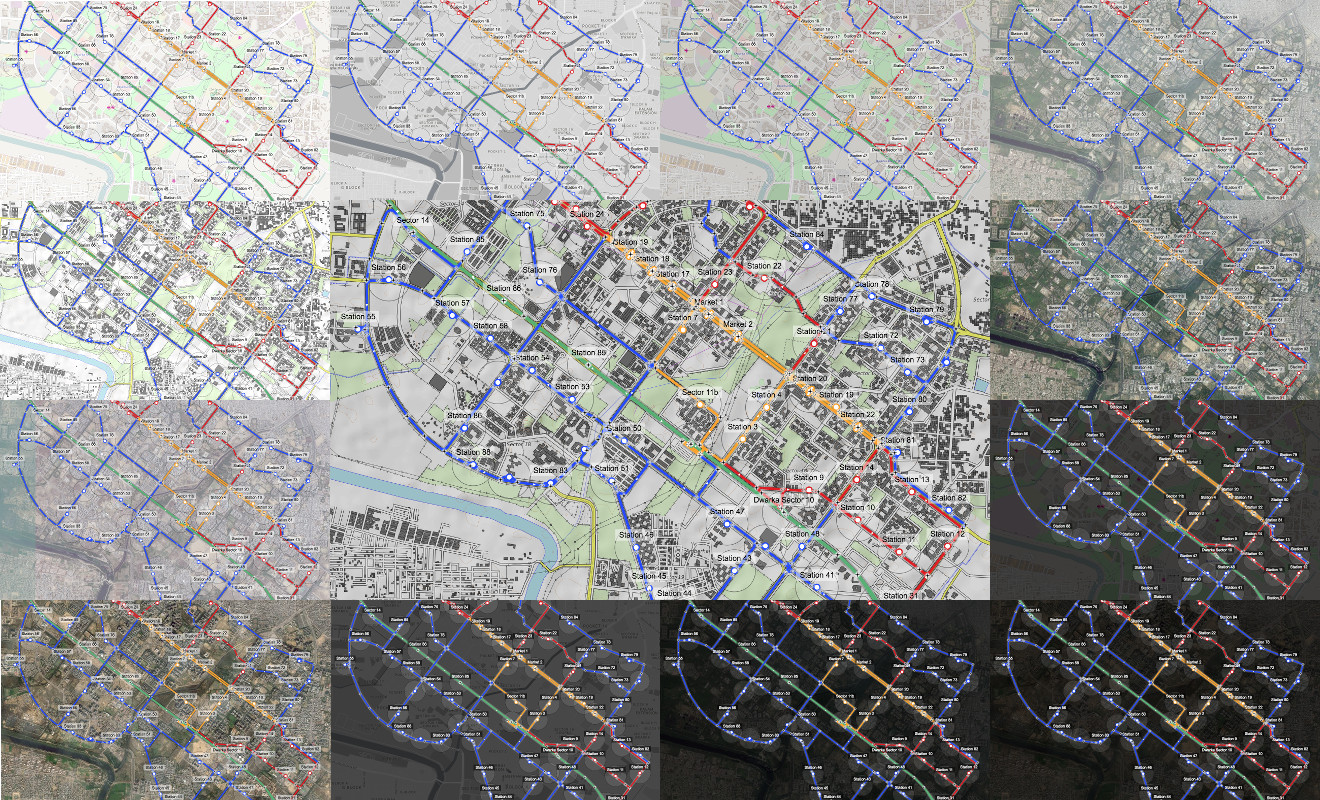
Different map types and background colours (click to enlarge)
Collaborator viewports
-
Show or hide the bounding box showing your collaborator's current viewport, and set its opacity.
Legends
-
Show or hide the on-map legends (for example, the legends created when colouring paths by mode, agency, attribute or average frequency).
Annotations
-
Show or hide all map annotations and set their overall opacity from 0 to 100%. These settings are saved with the view.
Street Network
-
Controls how the street network is drawn on the map. Street network lines and labels can be shown or hidden independently, so you can, for example, keep street lines for context while hiding the street names.
Rotate Control
-
Controls the on-map control used to rotate the map and reset its orientation.
- Visibility
- Auto - The control appears only when the map is rotated
- Show - The control is always visible
- Hide - The control is never shown
- Style
- Default - The standard rotate button
- North arrow - A north arrow that shows the map's current orientation
- Visibility
Paths
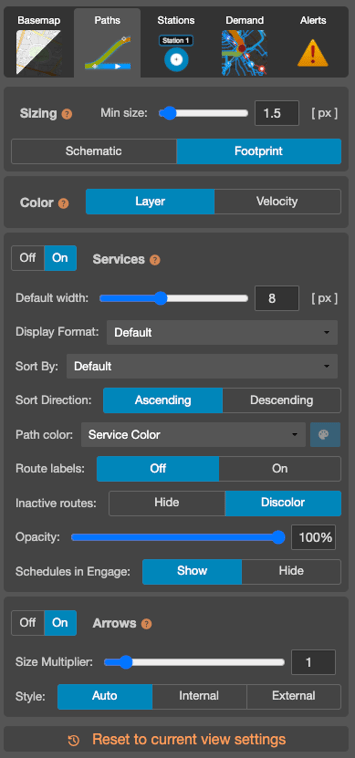
Sizing
- Min size - The minimum width of any path, in pixels
- Schematic - Use a consistent width for all paths
- Footprint - Use the physical right-of-way for each layer's LayerType
Colour
- Layer - Use the colour of the Layer
- Velocity - Show the speed based on the velocity profile of the LayerType
Services
- On/Off - Display service routes.
- Default Width (px) - The default width of service paths, in pixels.
- Display Format - How services are named in lists and on the map: Default, Short Name, Long Name or ID.
- Sort By and Sort Direction - The order in which services are listed, and whether that order is ascending or descending.
- Path Colour
- Service Colour - Colour according to the colour set in your route's settings
- Mode - Each transport mode will be displayed in a unique colour, as shown in an on-screen legend
- Agency - Colour paths according to transport agency
- Attribute - Colour paths according to a selected attribute. This also serves to create a legend for the attributes values on your map.
- Average Frequency - Colour paths according to the average frequency of the service. This also serves to create a legend for the average frequency values on your map.
-
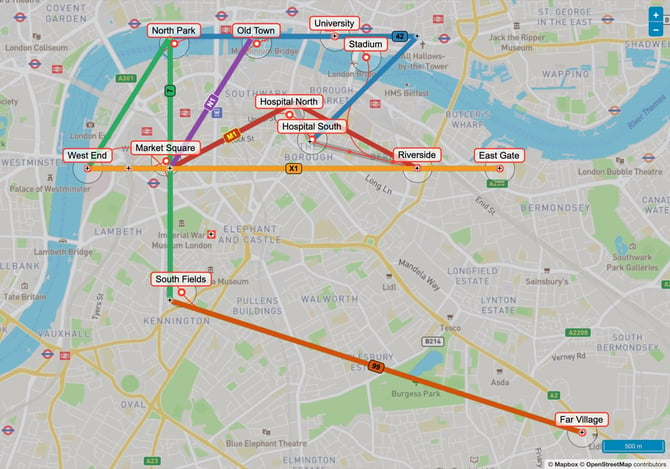
Route labels - Show route name badges along each route.
- When toggled On, the route's short name is shown. Routes without a short name get no label. Names longer than 12 characters are shortened with an ellipsis. You can set the short name in route settings.
- Placement - Labels repeat along long routes and are placed between stops, kept clear of the station dots and station names on the map. Overlapping patterns and both directions of travel share one set of labels. A branch that leaves the trunk gets its own label.
- Colours - The badge background is the route colour. The text uses the route's text colour if it has enough contrast against the background; otherwise Podaris uses black or white, whichever is easier to read. You can set the text colour in route settings.
- Always upright - Badges follow the direction of the line but never appear upside down, including when the map is rotated.
- Fewer labels when zoomed out - Labels are spaced further apart below street level, overlapping badges are decluttered, and no labels are drawn when zoomed out.
- Inactive Routes -- settings applicable to routes not active according the current time/date settings specified on the project clock
- Hide - entirely removes visibility of these routes
- Discolour - reduces the colour saturation of these routes
- Opacity - Set the opacity of services. This setting can make it easier to find overlapping services, and will be saved in the View Settings.
- Schedules in Engage - Choose whether schedules are shown to viewers in Podaris:Engage.
Arrows
Arrows describe the direction of traffic along a line. This can be changed to your specifications by modifying the 'actions' button on the 'control lines' section of the select tool panel.
- Size Multiplier - Increases or decreases the size of the arrowheads. The minimum value is 0.1, which makes arrowheads very small.
- Style
- Auto - Arrow styling is determined by Podaris, according to the current zoom level
- Internal - Internal (white) arrowheads appear inside the guideway
- External - External arrowheads share the layer's colour and are wider than the guideway by default
 When the path's colour is set to 'velocity', the arrow style should be set to 'internal' in order for arrows to be visible.
Stations
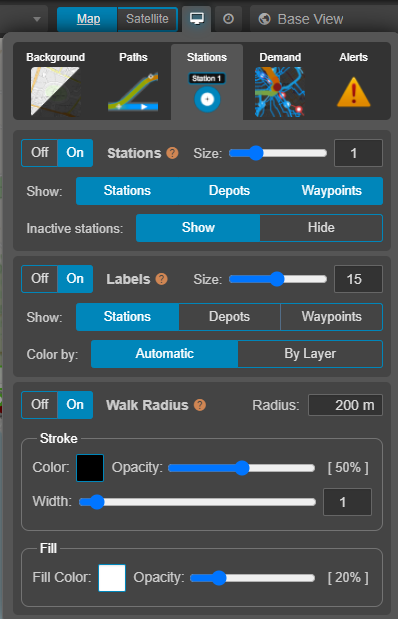
Stations
- On/Off - Represent stations as dots on the map
- Size - A multiplier based on the path size
- Show
- Stations
- Depots
- Waypoints
- Inactive stations -- settings applicable to stations without an active route according the current time/date settings specified on the project clock
- Hide - entirely removes visibility of these stations
- Show - Shows the station
- Colour by
- Automatic
- By Layer - Use the colour of the Layer
- By Zone - Use the colour of the station's zone
Labels
- Font size - In pixels
- Colour
- Automatic - Based on the background colour
- By Layer - Use the colour of the Layer
- By Zone - Use the colour of the station's zone
Walk Radius
Used as an indicator of station accessibility.
- Radius - Can be entered in any units
- Stroke - Colour, opacity, and width in pixels
- Fill - Colour and opacity
Demand
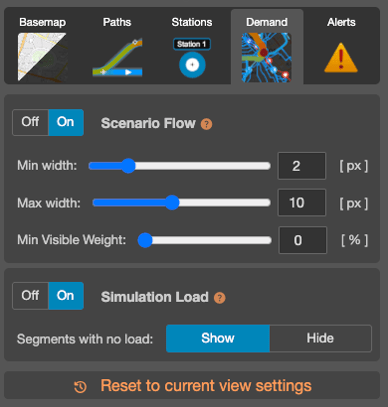
Controls how results from demand modelling are drawn on the map.
Scenario Flow
- On/Off - Show or hide scenario flow lines on the map.
- Min width - The width, in pixels, used for the lightest flows.
- Max width - The width, in pixels, used for the heaviest flows.
- Min Visible Weight - Hides flows below this percentage (0-100%). Raise it to remove minor flows and focus on the main corridors; at 0% everything is shown.
Simulation Load
- On/Off - Show or hide simulation load on the map.
- Segments with no load - Choose whether segments carrying no load are Shown or Hidden.
Alerts
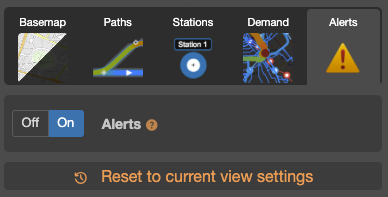
Alerts are used to give feedback to editors about issues within their projects. To learn more about the meaning of individual errors and how to see outstanding project issues, you can look within the alert manager. Note that they are only shown in Podaris:Plan, not Podaris:Engage.